Elevator pitch
Experiences during the Great Recession support the view that the UK labor market is relatively flexible. Unemployment rose less and recovered faster than in most other European economies. However, this success has been accompanied by a stagnation of productivity and wages; an open question is whether this represents a cyclical phenomenon or a structural problem. In addition the planned exit of the UK from the EU (Brexit), which is quite possibly the greatest current threat to the stability of the UK labor market, is not yet visible in labor market statistics.
Key findings
Pros
The UK labor market suffered less and recovered better from the Great Recession than most other EU countries, with unemployment now below its pre-2008 recession level.
While wage inequality was increasing until about the year 2000, it has been decreasing over the last ten years.
Both non-EU and EU immigrants had higher unemployment rates than UK-born workers before the Great Recession, but both groups have fared relatively better since 2008, and the gap with UK-born workers is now close to zero.
The female–male median hourly earnings ratio has been narrowing over time, reaching 90% in 2016.
Cons
After the 2008 recession, labor productivity still has not recovered to its pre-recession growth rate.
Real mean and median weekly and hourly earnings remain below their pre-recession levels.
The UK’s exit from the EU is likely to have large effects on its labor market but these effects are not yet visible in the statistics.
Author's main message
The UK labor market weathered the Great Recession well, at least compared to other European countries. Unemployment rose by about three percentage points, started declining relatively soon after, and is now back at the pre-recession level of around 5%. The flipside of this success story is a stagnation of labor productivity and earnings. While output per hour worked was steadily growing at about 2% annually before 2008, the crisis led to a seemingly permanent slowdown in productivity growth. This, together with the consequences of Brexit, poses major challenges for the UK government.
Motivation
The UK’s labor market is an important case to study since, although part of the EU, it has long been considered the most “American” of European labor markets. UK workers enjoy by far the least employment protection in Europe. Even internationally only a few countries, such as the US, Canada, and New Zealand, offer workers less protection [1]. Another distinct feature is that, because of language, the UK has for a long time been an attractive destination for both low- and high-skilled migration.
Discussion of pros and cons
Aggregate unemployment
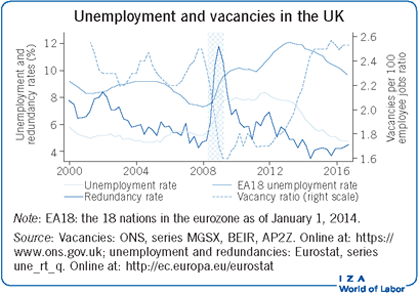
The Illustration shows the seasonally adjusted unemployment rate from 2000 to 2016. As indicated by the shaded area, the Great Recession in the UK started in the second quarter of 2008 and lasted five quarters. The unemployment rate rose from 5.4% to 7.8% in the second quarter of 2009. After that, it stayed elevated at slightly below 8%, but began falling in 2011. The reduction in unemployment accelerated in late 2013, and as of the fourth quarter of 2016, UK unemployment was below its pre-recession level, at 4.8%.
The Illustration also shows the redundancy rate (i.e. the number of redundancies per 1,000 employees) and the job vacancies ratio (i.e. vacancies per 100 employee jobs), which have been reported by the Office for National Statistics (ONS) since the second quarter of 2001. The redundancy rate, which was continuously falling until the second quarter of 2008, increased sharply during the recession before quickly returning to its pre-recession level. Vacancies, on the other hand, remained suppressed for several years after the official end of the recession and only increased to their pre-recession level toward the end of 2014.
In other words, while the increase in unemployment during the recession was a consequence of both increased redundancies (inflows into the unemployment pool) and less hiring (decreased outflows), the sustained high levels of unemployment after 2009 seem to be mostly due to the difficulty that unemployed workers experienced in finding new jobs.
While the UK labor market was substantially affected by the recession in 2008, it fared rather well compared to other European labor markets. The unemployment rate for the 18 nations in the eurozone as of January 1, 2014 (EA18) was consistently about three percentage points higher than in the UK with some signs of convergence before the 2008 recession (Illustration). The 2008 recession affected the EA18 unemployment rate much more profoundly than it did the UK’s. Accordingly, the unemployment rate in the EA18 stayed elevated for years after the financial crisis, and remained so as of the end of 2016.
Long-term unemployment
An important concern for both economists and policymakers is the development of long-term unemployment [2]. While short-term unemployment is a necessary side-effect of the reallocation of talent within the labor market, high numbers of long-term unemployed people may point toward structural problems in labor market institutions and thus may indicate the need for reform. Long-term unemployment also has important social consequences because a disproportional share of the burden of a recession is concentrated on relatively few individuals. It is a major cause of poverty and affects people’s mental and physical health. Furthermore, the long-term detachment of workers from the labor market may lead to a depreciation of their human capital, which makes it even harder for them to find a job in the future, potentially spurring a vicious cycle and increasing the structural rate of unemployment.
Figure 1 shows the long- (more than 12 months) and very-long-term unemployed (more than 24 months) as a share of total unemployment for the UK and the EA18. In the 2008 recession, long-term unemployment fell as a percentage of total unemployment, only to rise substantially during the recovery. This is consistent with the idea that the increase in the overall unemployment rate during the recession was driven primarily by increased redundancies, whereas the persistently high unemployment during the recovery was mostly due to low job-finding rates (as seen in the Illustration).
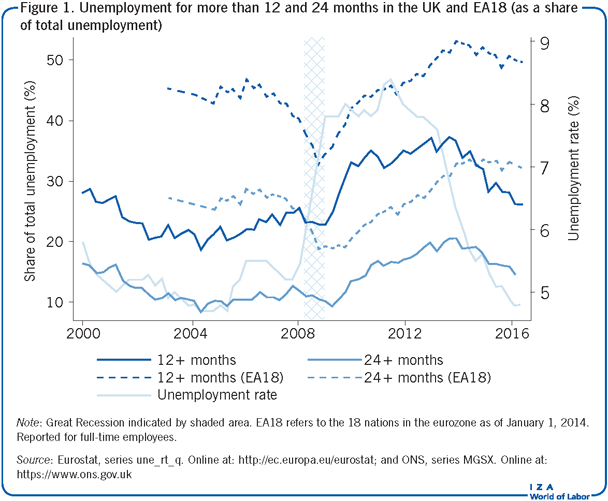
During the recovery, almost 40% of unemployed workers in the UK had been unemployed for at least a year. While striking, this number is relatively small compared to other European countries. The share of long- and very-long-term unemployment in the EA18 was about 20 percentage points higher than in the UK. Moreover, while the share of long-term unemployment in the UK started falling again in 2013 and is now back at pre-recession levels, the effect of the 2008 recession on long-term unemployment in the EA18 is still visible today.
Youth unemployment
Unemployment among young workers is particularly worrying, since it may predict elevated unemployment rates in the future. Moreover, because young unemployed people neither attend school nor gather labor market experience, high unemployment among this group may be an indicator of depressed future earnings.
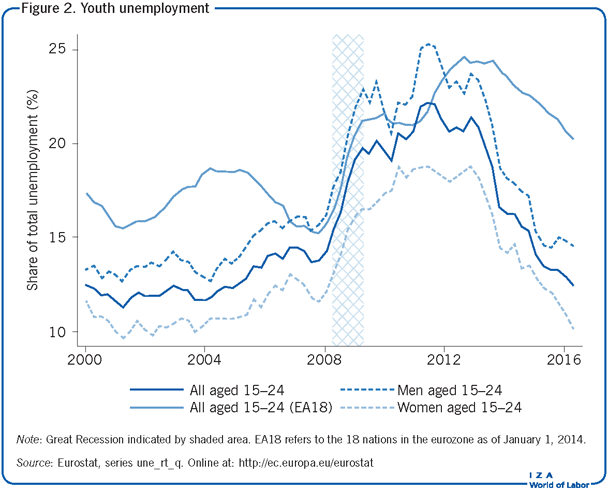
Figure 2 shows the unemployed aged 15 to 24 as a share of total unemployment for the UK and the EA18, as well as by gender for the UK. Youth unemployment contributed substantially to the overall increase in unemployment during the Great Recession: the share of youth unemployment in the UK went up from about 12% in 2000 to 20% by the end of the crisis. Youth unemployment stayed elevated for several years after the recession was over, but has recently returned to pre-recession levels. Again, the UK compares favorably with the rest of Europe in this respect.
Unemployment among immigrants
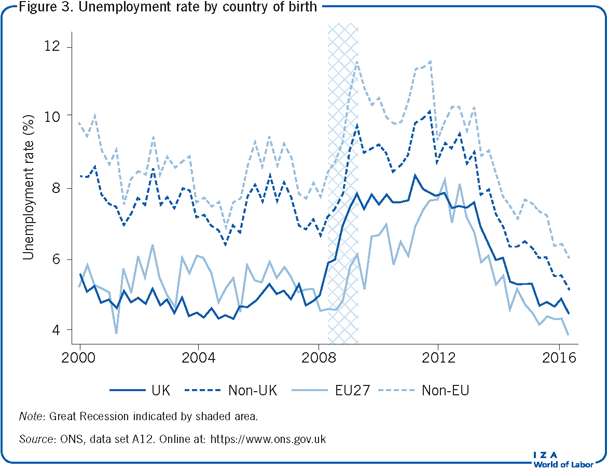
In the UK, as in other European countries and the US, foreign-born workers are more likely to be unemployed than native workers. Before the Great Recession, the unemployment rate of immigrants was about two percentage points higher than of the UK-born population. However, the Great Recession affected foreign-born workers less than UK-born workers, and immigrants have continued catching up in the subsequent recovery. By 2016, the difference in the unemployment rate between the two groups was reduced to 0.7 percentage points [3].
Figure 3 further decomposes the unemployment rate of foreign-born workers into workers born in the EU27, that is, the EU member states excluding the UK, and that of workers born outside of the EU. EU27-born workers had a slightly higher and non-EU27 workers a substantially higher unemployment rate than UK-born workers before 2008. However, since both groups fared better since the Great Recession, these gaps have narrowed, and unemployment among EU27-born workers has been slightly lower than that of UK-born workers since then.
Labor force participation
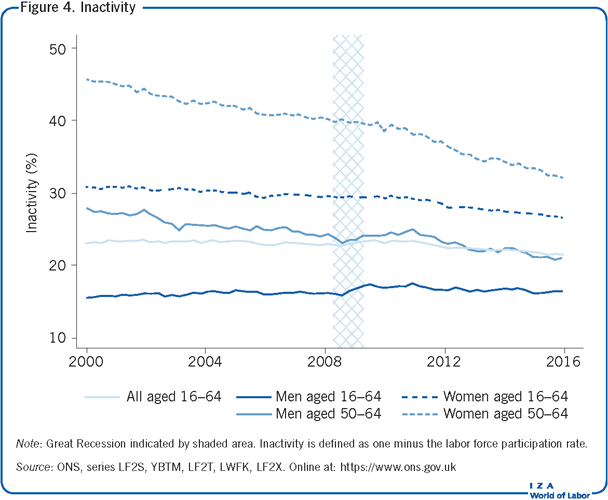
There have not been many changes in labor force participation in the UK over the past 15 years. As in most developed economies, and as Figure 4 shows, there has been an increase in female participation, particularly of 50−64 year olds. But contrary to the US, inactivity (one minus the labor force participation rate) only slightly increased after the Great Recession.
Productivity and wages
While the UK fared rather well in the aftermath of the Great Recession compared to the rest of the EU in terms of employment, an examination of productivity and wages tells a different story. Figure 5 shows labor productivity in the UK measured as output per hour worked (relative to its 2013 level), along with mean and median weekly and hourly pay. Output per hour was growing steadily at almost 2% per year until it fell sharply in the 2008 recession. Since then, productivity growth has remained permanently below its pre-recession level, and output per hour only recently reached its pre-2008 level. This permanently low post-recession productivity growth has attracted a lot of attention. It is at odds with the recovery of productivity following previous recessions in the UK, and is often referred to as the “productivity puzzle” [4]. In 2016, GDP per hour worked in the UK was 11% lower than the EA18 average and 20% below that of Germany, leading Chancellor of the Exchequer Philip Hammond to complain that it “takes a German worker four days to produce what we make in five.”
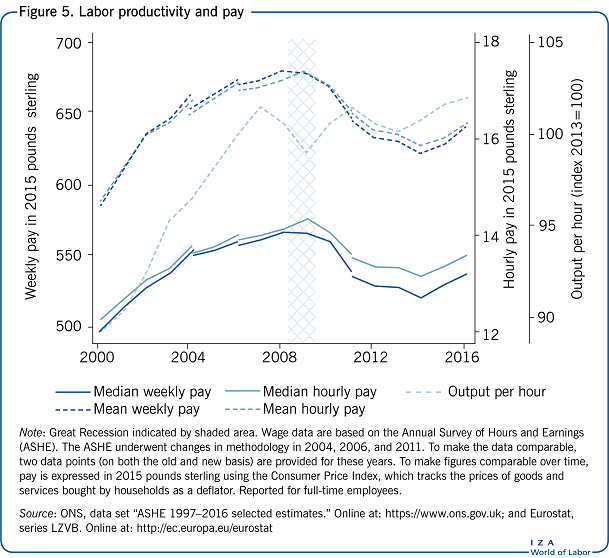
The disappointing evolution of productivity is reflected in wages. All measures of wages show a very substantial reduction in real pay since the 2008 recession. Although wages did not respond much initially when the recession hit, until very recently they have fallen continuously. Pay was still well below pre-recession levels as of 2016. There is also some indication that the 2008 recession led to a reduction in hours worked, as weekly pay has been lagging even more than hourly pay.
One possible explanation for the UK’s slow productivity growth is a tendency toward an increasing share of the workforce being employed either part-time or with contracts that do not guarantee a minimum number of hours, so-called “zero-hours” contracts. While such labor contracts make the labor market more flexible, they may negatively affect incentives to invest in workers’ human capital, which may have contributed to the disappointing productivity growth.
Earnings inequality
A two-decades-long rapid increase in earnings inequality in the UK came to a halt around 2000 and may have started to reverse in recent years. Figure 6 shows different measures of earnings inequality based on gross weekly earnings for full-time employees. As of 2016, the 90th percentile of weekly earnings was slightly less than double median pay, and this 90/50 ratio has stayed roughly constant since 2000. The median was around 1.8 times the 10th percentile, and this 90/10 ratio has declined somewhat, with growth in low wages outstripping wage growth for high earners. As a consequence, the 90/10 percentile pay ratio has decreased over the sample period, especially in the last few years [5].
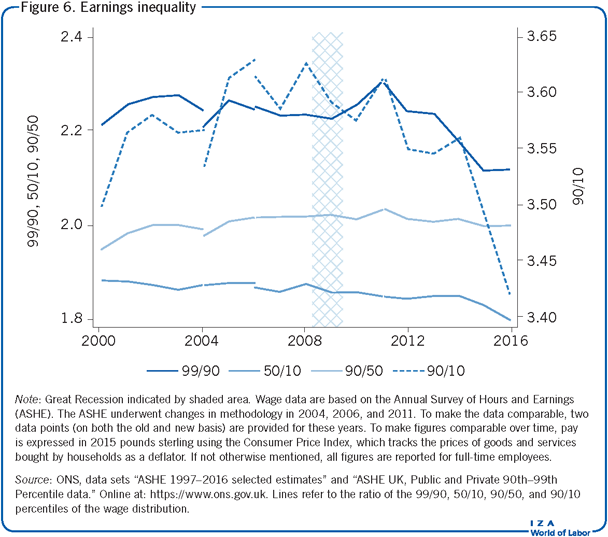
Furthermore, Figure 6 shows the evolution of inequality at the very top of the earnings distribution. There is a concern, particularly in the US, that earnings growth of the “lucky few” is vastly outpacing that of other workers. As can be seen in the figure, this is not the case in the UK. The 99/90 percentile pay ratio in fact decreased slightly from about 2.2 to 2.1 over the 16 years.
Female–male earnings differences
Since the Equal Pay Act was passed in 1970, it has been illegal in the UK to reward women and men differently for the same work. Nevertheless, the gender wage gap has been slow to close. The good news is that, half a century later, significant progress has been made.
Figure 7 shows median female pay as a share of median male earnings. When considering all employees, women still earn much less than men, although the difference is slowly disappearing, from about 57% in 2000 to slightly over 65% in 2016. Interestingly, the recession seems to have sped up the shrinking of the gender wage gap somewhat, indicating that men were relatively more badly affected by the 2008 recession than women [6].
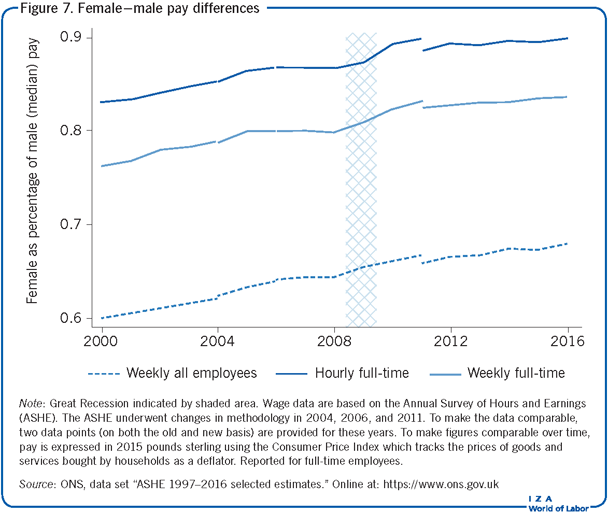
A large part of that difference in pay is due to women working fewer hours. When considering only full-time employees, the ratio of female to male pay in 2016 was 83%. When looking at hourly instead of weekly earnings, the ratio further increases to about 90%, so the remaining pay gap in 2016 was about 10%. In addition, a simple comparison of female and male (median) pay per hour does not take into account differences in pay due to composition effects, that is, the fact that women and men tend to be employed in different industries or occupations. Controlling for these factors is likely to further decrease female–male pay differences and the 10% gender wage gap should therefore be seen as an upper bound.
Limitations and gaps
Among the limitations in evaluating the UK labor market are its substantial regional disparities: unemployment rates, earnings, and labor productivity vary across regions, in particular between London and the rest of the UK. These disparities are quantitatively important, and there is no apparent “convergence” over the last 15 years.
One of the main gaps in the research presented in this article involves an event that is likely to have the biggest impact on the UK labor market since the Great Recession, but which falls just outside of the current sample period. On June 23, 2016, the UK voted to leave the EU, and on March 29, 2017, Article 50 of the Lisbon Treaty was triggered to start this process, so that the UK is due to leave the Union on March 29, 2019. To this point, it is unknown how and to what extent leaving the EU will change trade agreements between the UK and other countries. However, it is clear that any worsening of the conditions under which UK firms can participate in international trade will have major labor market impacts. Another key component of leaving the EU is that the UK will be able to limit the rights of European immigrants to work in the UK. The effects of Brexit on the UK labor market are therefore likely to be substantial. European immigrants are strongly overrepresented in some occupations, so that limiting immigration is bound to increase labor market mismatch, at least in the short term. However, it will be at the end of the next decade at the earliest that this effect will be visible in the statistics.
Summary and policy advice
The UK labor market weathered the Great Recession well, particularly in comparison to other European countries. Unemployment rose by about three percentage points when the recession hit, but started declining relatively soon thereafter. As of 2016, it had dropped back to its pre-recession level of around 5%. Additionally, unlike in other very flexible labor markets such as the US, earnings inequality has been decreasing for the past 10 years.
While the UK has made a swift recovery in several key areas, one cause for concern is the stagnation of earnings and an apparently permanent slowdown in labor productivity growth after the Great Recession. The underlying causes of this productivity puzzle are still unclear. Some argue that it is a direct consequence of the flexibility of the UK labor market, since the availability of cheap labor implies that firms have relatively little incentive to invest in automation or other labor-saving technologies. This might result in a lower capital−labor ratio. Moreover, this flexibility causes workers to have on average short job tenure, which means that incentives to invest in on-the-job training and job-specific human capital may be lower as well.
If this explanation is correct, then concern about the productivity puzzle may be misplaced, since it is just the price to pay for the remarkable success of the labor market after the 2008 recession. It is not clear, however, why labor productivity recovered faster after previous recessions, when the labor market was similarly flexible. Some observers therefore argue instead that the post-crisis change in the productivity growth is directly related to an overly lax monetary policy, which allowed inefficient firms that would not normally be competitive to survive. An alternative, more positive interpretation is that the UK economy is going through structural changes that come with painful reallocations in the medium term, but which will imply high productivity growth in the longer term.
Acknowledgments
The authors thank an anonymous referee and the IZA World of Labor editors for many helpful suggestions on earlier drafts. The opinions expressed in this publication do not necessarily reflect the opinion of the European Commission.
Competing interests
The IZA World of Labor project is committed to the IZA Guiding Principles of Research Integrity. The author declares to have observed these principles.
© Benedikt Herz and Thijs van Rens