Elevator pitch
The Netherlands is an example of a highly institutionalized labor market that places considerable attention on equity concerns. The government and social partners (unions and industry associations) seek to adjust labor market arrangements to meet the challenges of increased international competition, stronger claims on labor market positions by women, and the growing population share of immigrants and their children. The most notable developments since 2001 are the significant rise in part-time and flexible work arrangements as well as rising inequalities.
Key findings
Pros
The employment-to-population ratio has increased from 61.1% to 65.8%.
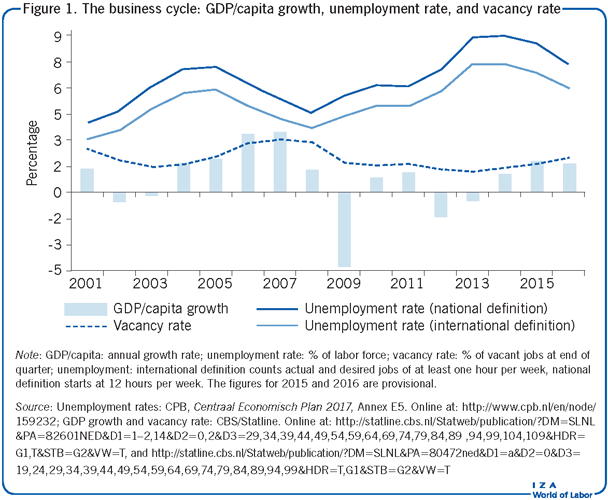
Unemployment started to fall in 2014 after a significant increase following a recession in the aftermath of the global financial crisis and the euro crisis.
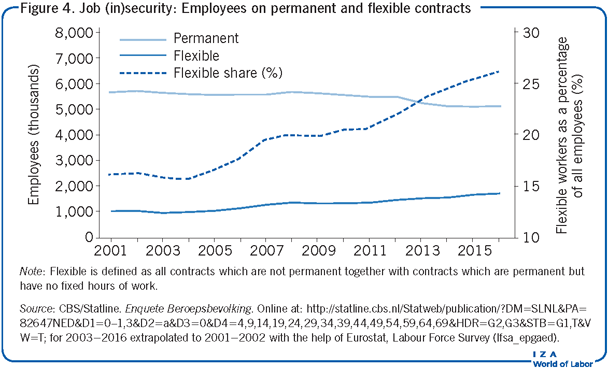
The Dutch labor market is highly flexible, being characterized by a large share of part-time and flexible work arrangements and labor contracts.
Cons
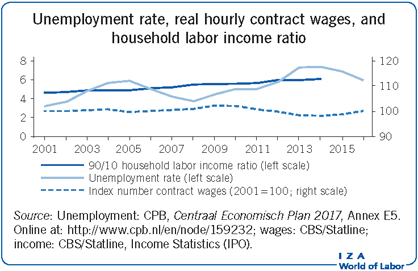
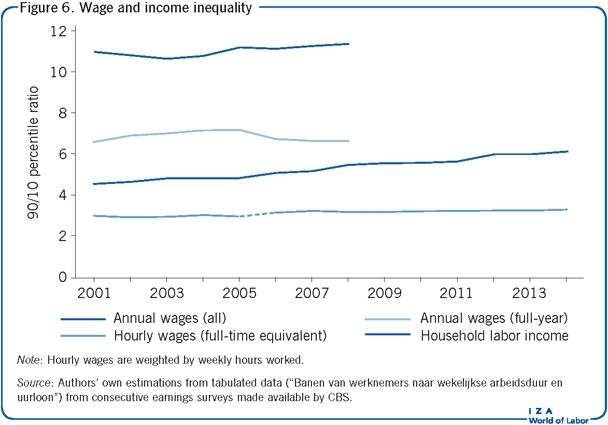
Labor market inequalities are growing; in particular, hourly wage inequality increased, with the 90th-to-10th percentile ratio rising from 3.0 to 3.3.
Protection of vulnerable workers has deteriorated as employers shift an increasing amount of risk onto employees.
The labor force has aged considerably, leading to lower overall labor mobility and provoking tough discussions on the pension system and the retirement age.
The labor market has faced difficulties integrating immigrants, particularly those from non-Western countries, who lag behind natives in most metrics.
Author's main message
Increased competitive pressures and stronger volatility in output markets have motivated employers to shift a growing proportion of financial risk onto workers. With weakened labor unions and a government that is rolling back social policies, employers have been able to keep wages down and to hire from a more varied labor force. New contract arrangements have provided workers more opportunities to engage in flexible and part-time work, but have also raised job and career insecurity. Policymakers should endeavor to provide both specific and general training to workers who no longer receive sufficient training from their employers.
Motivation
The Dutch labor market stands out internationally, with an extremely high frequency of part-time work, a rapid increase in the share of flexible contracts, and a dominant household type consisting of 1.5 labor participants: typically, a full-time working husband and a part-time wife. This illustrates one way of dealing with increased globalization and international competition as well as with the competing pressures of work and family life.
Discussion of pros and cons
General setting
Social dialogue has been a hallmark of the institutional framework in the Netherlands since 1945. This dialogue involves three parties: employer associations, union federations, and the government. It stretches beyond affairs directly concerning employers and employees, extending to such matters as social and labor market legislation, the pension system, and a broad range of economic policy issues, with much explicit attention given to economic equity. Essentially, the basic institutional framework has been stable for decades, within which the balance of power shifts over time. The structure is particularly important for unions, as they have comparatively little presence in the workplace and face declining density; their organizational coverage is now far below that of employer associations. The model has become known for its tradition of wage moderation and annual preoccupation with the effect of the following year’s budget proposals on inequality. Since the liberalization of international capital movements, employers have increased their power vis-à-vis the other two partners in this social dialogue. Since the formation of the EU monetary union, the government has also faced increasing constraints on policy making.
As Figure 1 shows, economic activity declined slightly in 2002 and 2003, fiercely in 2009, and then again in 2012 and 2013. The Dutch economy is strongly export-oriented, with exports growing from 66% of GDP in 2001 to 82% in 2016, a large and growing share of which is transit trade (currently 40%). The trade balance surplus has grown from 6% to 11% of GDP, which has evoked comments, e.g. from the Netherlands Central Bank, that the wage level is too low.
Employment
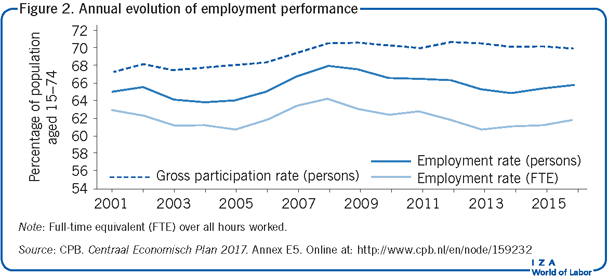
Between 2001 and 2016, the population of the Netherlands grew from 16.0 to 17.0 million, at an average annual growth rate of 0.43%, and the working-age population (15−74 years) grew at a similar speed, from 12.0 to 12.8 million. However, the number of people in the labor force grew at a faster rate, going from 8.1 to 8.9 million (+0.74% annually). This lifted the (gross) participation rate from 67.3% to 70.0%, and the employment rate from 65.1% to 65.8% (Figure 2).
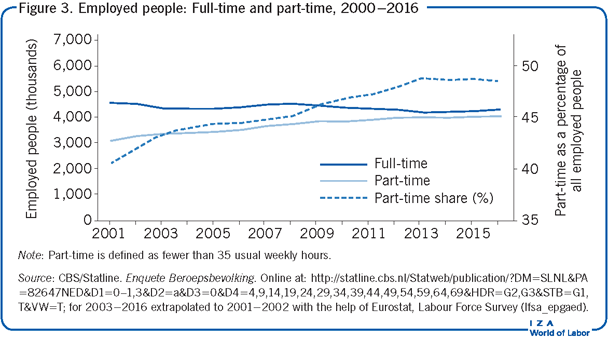
However, despite the relatively rapid increase in employment, the volume of hours worked grew at a slower pace (+0.33% annually), lagging behind population growth. Hence, the annual number of hours worked per capita of the working-age population has decreased since 2001 (−0.08% annually). This decline is a consequence of the strong growth in part-time work (Figure 3). The number of part-time workers grew on average by 1.64% annually, while the number of full-time workers decreased by 0.71% per year. Currently, half of all employment is part-time (defined as fewer than 35 usual weekly hours). In 2001, 11.8% of all employed people held a small job, meaning that they worked fewer than 12 hours a week; the share had declined slightly to 11.3% by 2016. However, among youth aged 15−24, this share grew significantly, from 36% in 2001 to 44% in 2016. In 2001, 60% of employed people in this age group were also in school; by 2016, this percentage had risen to 70%. Ignoring small jobs would lower the overall employment rate by more than seven percentage points in both years.
Flexibility and job security
The incidence of flexible jobs has grown rapidly (Figure 4), from around 16% in 2001−2004 to 26% in 2016 (according to the definition of Statistics Netherlands (CBS), which casts a wider net than Eurostat’s Labour Force Survey (LFS)). Flexible jobs comprise any job with a temporary contract, including temporary agency work and on-call contracts; they also include the probationary periods of jobs that are meant to become permanent, as well as jobs that are legally permanent but have undefined, flexible hours (a small number). The proportion of flexible jobs that count fewer than 12 hours per week has remained steady since the turn of the century, at about one-third. Conversely, the incidence of flexible contracts among small jobs was a stunning 73% in 2016, compared with 50% in 2003. Among larger jobs (more than 12 hours worked), the incidence grew from 12% to 20% over the same period. Interestingly, small jobs, flexible as they may be, have less cyclical sensitivity than larger jobs (see Figure 1). Among flexible jobs, there is a clear shift toward the most flexible contracts, which is seen in the number of on-call contracts expanding by 114%. These are followed by permanent contracts with flexible hours (93%) and fixed-term contracts without fixed hours (82%), though the total numbers for these latter two are still low. The most traditional type of flexible contract, temporary agency work, which characterized the early stages of growing flexibility and was the prime subject of regulation in 1996 (the “flexicurity deal” concluded by the social partners and enacted by the government in 1999), grew by one-third from 2001 to 2016. The incidence of flexible contracts is rising across all relevant characteristics, but shows particularly large differences by age (young people are very likely to hold small jobs). However, there are surprisingly small differences across education levels and gender (while a higher proportion of women work part-time, many have permanent contracts).
The number of self-employed workers without personnel (i.e. single self-employed) has also expanded rapidly. In 2016, about one million workers operated primarily in this way (up from 641,000 in 2003) [1]. They enjoy preferential tax treatment and are not covered by mandatory social welfare arrangements (company or industry pension plans, disability, sickness, and unemployment insurance). The challenge for policymakers when it comes to this group is the high level of variation: some self-employed people deliberately opt for this status, while others are forced into it by unemployment or by employers, maneuvering to reduce wage costs by replacing employees (either with already self-employed workers or by rehiring an employee under a self-employment contract, which typically excludes employment protections and pays lower wages). Variation is also found in the types of occupation, which include, for example, shopkeepers, medical specialists, farmers, construction workers, and truck drivers.
In 2011, about one-third of those starting out as single self-employed did so from states of unemployment, disability, or welfare recipiency. In 2015, only 10% of the single self-employed said they would prefer to work as an employee, indicating that this is a preferable work state for many individuals, despite the potentially disadvantageous contract conditions imposed on some of them by employers.
Employment heterogeneity
Gender
The gross labor force participation rate has essentially remained constant for men, but increased for women from 59% in 2003 to 65% in 2016 (data in this section come from the LFS, Enquete Beroepsbevolking). The largest increase was among women with secondary education, whose participation rate rose by seven percentage points. The gender gap in participation rates is largest for those with less than secondary education, at some 20 percentage points in 2016 (43% versus 62%); for those with intermediate education, the gap is seven points, and for the higher educated it is a mere two points.
The female employment rate increased from 55% in 2001 to 61% in 2016, while for men it fell from 74% to 71%. Women’s share in the labor force increased over this period, from 43% to 46%. Though the prevalence of part-time work grew more rapidly for men than for women (2.11% versus 1.46% annually), it is vastly more important among women (accounting for 76% of all employed females in 2016) than for men (only 26%). Its importance declines as educational attainment increases, starting from 87% for low-educated women, 81% for the intermediate educated, and dropping to 65% among the higher educated. However, the latter stand out in international comparison—higher-educated women in the Netherlands work part-time 2.5 times more often than the eurozone average, as opposed to lower- and intermediate-educated women, who work part-time twice as often as the eurozone average.
Age
The age composition of the labor force has changed dramatically in the Netherlands since the turn of the century. The share of older workers (55−74) among the employed increased from 11% in 2003 to 19% in 2016. The share of the prime aged (25−54) decreased from 74% to 66%. The share of youth (15−24) remained constant at 15%. Older workers have also shown a substantial increase in labor force participation at all levels of education. This trend toward an older labor force is a consequence of falling birth rates in the past. It leads to lower aggregate labor mobility and to discussions about the pension system and the retirement age. The mandatory age of retirement is being gradually increased, and in some occupations this puts quite a strain on workers.
Education
The level of education of the working-age population (15−74) has increased since 2001, as the share of lower-educated individuals fell and the share of higher-educated individuals grew. The share of the intermediate educated, meanwhile, remained stable. This development was stronger for women than for men. Between 2003 and 2014, the share of lower-educated men fell by six percentage points, while that of the higher educated increased by five points; for women, the decline was nine points and the increase eight points, respectively. Thus, women are catching up with men in terms of education, with the gender gap in the share of higher-educated individuals decreasing from 5.3 to 2.7 percentage points.
Immigrants
The Netherlands has been a country with positive inflows of immigration since the late 1970s, after three-quarters of a century with net migration hovering around zero. The share of the population with a foreign background continues to increase. In 2003, 9% of the employed labor force (aged 15−74) had an immigrant background from a Western origin country (mostly OECD countries) and 8% came from a non-Western origin country, such as Turkey, Morocco, Netherlands Antilles, and Surinam (these statistics follow the Dutch practice of combining first- and second-generation immigrants, which means born from at least one foreign-born parent). In 2016, these shares had both increased to 10%. Among Western immigrant men, participation rates are barely different from those of native men, but for non-Western immigrant men, the gap is five percentage points (71% versus 76%). Among women, the situation is comparable: two points lower for Western immigrant women and seven points lower for non-Western immigrant women. However, while participation rates for non-Western men remained virtually constant from 2003 to 2016, for women they increased substantially, by some six-to-seven percentage points.
Western immigrants have substantially higher levels of education than native Dutch people because of different age distributions, and the gap has been increasing. In 2003, 27% of Western immigrants had the lowest level of recorded education (elementary and lower vocational), compared with 39% of native Dutch people. Meanwhile, 10% of Western immigrants had a university education, against 7% of native Dutch. In 2016, the comparison was 27% versus 32% for the lowest education level and 15% versus 10% for a university education. Non-Western immigrants have a lower education level than native Dutch; however, among these immigrants, the share with the lowest education level has decreased dramatically, from 54% to 39%. The unemployment rate among Western immigrants is about 1.5 times that of natives, with mild fluctuations over time. Among non-Western immigrants, the ratio is about 2.8, with somewhat larger fluctuations. Trends, in either direction, are not visible. Among people active in the labor market, Western immigrants compare well, with incomes close to or above those of native Dutch people. By contrast, non-Western immigrants fare much worse. Second-generation non-Western immigrants had a markedly better relative position in 2001 than in 2014, with an average personal income at 63% rather than 51% of the native Dutch average, and an average income at 77% rather than 51% when standardized for size and composition of the household. The reason for this decline is not clear; it may be due to a composition effect by origin country (e.g. an increase in the share of refugees) and also by age (the non-Western labor force comprising more youth, who generally suffered a stronger earnings decline).
Job content
The nature of tasks to be performed and, hence, the requirements put on workers, have changed substantially over the last 20 years. A recent study employs indices for the intensity of the routine character in the tasks to be performed in an occupation and distinguishes five types: routine manual, non-routine manual, routine cognitive, non-routine analytic, and non-routine interactive (the study estimates the share of each category in the total workload) [2]. Between 1996 and 2015, relative to occupations with a high share of non-routine analytic tasks, employment growth is significantly lower in occupations with high shares of the other four task categories, especially for those that are primarily routine manual. Likewise, between 1999 and 2012, wage growth by occupation is significantly lower in those four categories when compared with non-routine analytic occupations, by some 7% to 15%.
Evolution and distribution of wages
Some three-quarters of the Dutch labor force are covered by collective agreements, which, among other things, stipulate occupation-related seniority wage scales (so-called “contract wages”) and are mostly bargained at the industry level. Regular wage bargaining covers the general adjustment of nominal wage levels to account for the evolution of prices and productivity; the bargaining process depends on economic projections of the Dutch Central Planning Bureau (CPB), the government’s main economic advisory body [3]. For many workers, this is the only source of pay increase [4]. The evolution of contract wages per hour of work reflects the general pay increases established between unions and employers in their collective labor agreements. These increases are directly observed by the CBS and presented by means of an index number, using a fixed weighting of employees distributed by individual collective agreements. This is a core statistic in the Netherlands, which controls the adjustment of both the statutory minimum wage and social benefits (and thus government spending).
As shown in Figure 5, contract wages have essentially been unchanged in real terms since 2001. Note that this core statistic leaves out several important aspects of earnings. First, it excludes annual payments, such as statutory holiday allowances and additionally contracted 13th or 14th month payments. A sister statistic that does include these additional payments shows a 4% real increase from 2001 until 2009/2010, followed by a 2% decline by 2016. Second, the statistic focuses on employee earnings as actually negotiated between unions and employers; consequently, it excludes employer contributions to social insurance and occupational pensions, which are part and parcel of total labor costs. Third, over time and if applicable, individual workers move up in seniority scales as stipulated in the collective agreement irrespective of the general evolution of contract wages; such shifts are not observed.
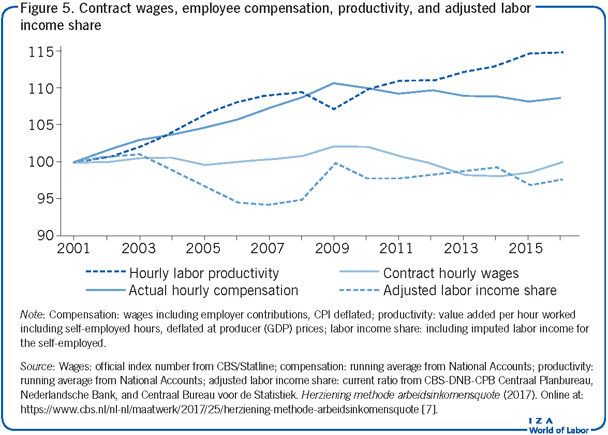
Unfortunately, there is no index number of actual wages available for comparison with which one could determine the effect of collective negotiations on actual outcomes—only the National Accounts data on “compensation of employees” exists. Its evolution deviates from that of contract wages for a number of reasons. First, it includes employer contributions to social insurance and occupational pensions. Second, it incorporates pay changes due to seniority. Third, it concerns a running average without a fixed employment structure, and certainly not a fixed distribution over collective agreements; consequently, the evolution of employee compensation also reflects changes in the composition of employment, including possible shifts to better- or worse-paying collective agreements.
Real hourly compensation of employees rose by 11% from 2001 to 2009, and then fell by 3% by 2015. As a result, it is unknown whether labor contracts showed continued wage moderation and lagged actual average earnings. Moreover, it is impossible to pin down the difference between the two or to say how much the former has contributed to the latter. At the same time, hourly labor productivity—also a running average—grew by 15% over the study period, with a sharp drop in 2009 and lower growth thereafter, implying increased employment intensity of economic growth. Thus, real compensation, deflated at consumer prices, has been lagging behind productivity since 2008. However, if compensation is deflated at product prices, as is relevant for producers, then it would follow productivity development quite closely. This implies that producer prices increased less than consumer prices, likely as a result of strong (international) competitive pressure that has kept Dutch export prices virtually unchanged since the mid-1980s, in contrast with many other countries [5].
The adjusted labor income share in national income [6] follows the deviations between compensation and productivity development, with a drop toward 2006 and an increase thereafter, resulting in a modest decline over the entire period [7]. The adjusted labor income share in national income is a key policy statistic, which influences wage bargaining and the minimum wage and affects social benefits when it exceeds a certain threshold; it has been declining from 66% in 1981 to 62% in 1991, reaching 59% in 2001.
Figure 6 exposes the evolution of inequality, as measured in ratios of the ninth to first decile cut-off values (90th vs 10th percentile). In terms of hourly wages for full-time equivalents (FTE), where every worker is counted according to the fraction of a standard week/standard year they work, the ratio grew from 3.0 in 2001 to 3.3 in 2014. The 90th percentile of hourly wages rose, while those for the 10th percentile stagnated in striking parallel with the adult minimum wage. Inequality in annual wages, for which observations are only available until 2008, is much higher, at a ratio of around 11, reflecting the large inequality in weekly and annual hours worked. If only full-year workers are considered (eliminating part-year, but retaining full-year part-time), the 90th to 10th percentile inequality is substantially reduced, to a level between 6.5 and 7.0. When looking at labor households (i.e. primary incomes of households whose main income is from labor earnings), inequality is again slightly lower, as part-time workers typically share a household with a full-time worker [8]. Household inequality rose from 4.6 to 6.1 between 2001 and 2014, pointing to growing inequality in terms of annual hours worked between households.
The dynamics of household formation complicate the assessment of wage inequality for inequality of welfare. Households share more than one income, and part-time and part-year work are pervasive and unequally distributed. Dual-earner households take most of the responsibility for the rapid increase in wage earnings within the top 10% share of income (90th percentile group) [9]. However, if one moves from the distribution of gross incomes to that of net incomes (i.e. standardized for the number and age of household members), many dual-earner households drop from the top to the middle of the income distribution [10]. This perspective shines a different light on a large part of the much debated “disappearance” of the middle class in the Netherlands. With a middle class defined as having an initial household income at 60% to 200% of the median, its share in the total number of households does indeed fall considerably (from 68% to 57%) between 2001 and 2014 when considering gross income. However, the fall is less severe (from 71% to 65%) when considering net income, and even less (from 81% to 76%) after standardizing for household size and composition [11]. Thus, while inequality among household earnings has increased, the combined impact of changes in wages, household sizes and composition, labor supply behavior, and distributional policies on standardized household income inequality seems fairly modest.
Limitations and gaps
The heterogeneity of labor demand in the Netherlands has increased along several dimensions. Job qualifications have become more specific as jobs have become more idiosyncratic. Labor demand has become less stable as product-market uncertainty and volatility have increased, and employers increasingly seek to pass risks on to workers. With this in mind, not all dimensions of risk allocation, such as job and employment instability and earnings variability, have been documented in this article, and some are not even found in standard statistical records.
The relationship between individual labor supply and the formation and composition of households has become increasingly complex. For instance, higher wage levels and government income support programs facilitate single-person and single-parent households; high-income household members facilitate partners to forgo earnings in favor of other job characteristics; preferences for household work and childcare increase the supply of flexible part-time work; and students combine school and work by taking small, often flexible jobs. These factors increase the importance of the household setting for individual labor supply, make individual earnings less dominant for the distribution of individual welfare and, conversely, make individual economic potential a more important determinant of household formation and break-up. Thus, conditioning economic outcomes on the increasingly complex household situation becomes more important, while, at the same time, the reverse relationship should not be ignored.
Summary and policy advice
It is easy to summarize the macro developments in the Netherlands over the past decade and a half: there were some cyclical swings in employment and unemployment; a strong recession in 2008−2009; a stagnant average wage for given work; an actual average wage lagging behind productivity growth; and a slightly diminished labor share in national income, continuing a longer-term trend.
However, below the surface of these aggregate developments there is much heterogeneity with many interacting features. Increased uncertainty, volatility, and product-market competition fuel employers’ growing demand for flexible labor contracts. This puts strain on some categories of workers, such as low-wage workers with little opportunity for self-employment, while others enjoy the increased opportunity for autonomy and flexibility. Labor supply has become more fragmented in terms of contract types, hours worked, and its distribution within households. Both men’s and women’s labor market behavior have become more diverse. Students and women with a partner are increasingly seeking part-time, flexible work opportunities for the earnings and job satisfaction that these can provide, in combination with other non-work-related activities, such as care work or education. However, this may augment the labor supply pool, and negatively affect other workers seeking full-time opportunities. More than ever, labor supply is a household decision; but, conversely, the formation of households also responds to the opportunities in the labor market.
Looking ahead, a major policy challenge is to ensure investment in human capital for the growing share of part-time and flexible workers (including both job-specific and more general skills), for whom employers have fewer incentives to provide training. The social partners control investment funds based on collective labor agreements that are specifically designed for this purpose, but there is no evidence that they are being effectively used to enhance worker skills. Moreover, these funds are organized along industry lines, which is not conducive to provide general, non-industry-specific training that would be necessary to support cross-industry job mobility. To combat this challenge, policymakers should consider establishing an institution that stimulates and helps in the financing of training for individuals beyond the age of initial education.
Acknowledgments
The author thanks the IZA World of Labor editors for many helpful suggestions on earlier drafts. Previous work of the authors contains a larger number of background references for the material presented here and has been used intensively in all major parts of this article [4], [8], [10].
Competing interests
The IZA World of Labor project is committed to the IZA Guiding Principles of Research Integrity. The author declares to have observed these principles.
© Joop Hartog and Wiemer Salverda