Elevator pitch
The economic crisis in the early 1990s brought about a dramatic increase in unemployment and a similar decrease in labor force participation. Unemployment declined afterwards, but stabilized at around 6–7%—more than twice as high as before the crisis. Today, the unemployment rate is lower than the EU average, though Sweden no longer stands out in this respect. The 2008 financial crisis had small effects on the Swedish labor market. Employment in industry declined sharply and then remained stagnant, but employment in the service sectors has continued to grow steadily.
Key findings
Pros
Labor force participation and employment rates in Sweden have increased and are now among the highest in the EU.
The unemployment rate has been fairly stable and is below the EU average.
Labor force participation among women is close to that of men, and labor force participation among older workers is high and trending up.
Wage inequality is low and stable and women’s wages are catching up.
Real wages have increased steadily for all major groups of workers.
Cons
Labor force participation among young workers has declined.
The unemployment rate is more than twice as high as it was in the 1970s and 1980s.
Workers without upper secondary school education do poorly in the labor market, and their problems appear to be growing.
Immigrants have high unemployment rates, but there is a positive trend in participation and employment rates.
Income differentials have increased between those who have a job and those who do not.
Author's main message
Labor force participation and employment rates in Sweden are now among the highest in the EU. Real wages have increased steadily and the overall wage distribution has been very stable (and compressed) since 2001. The gender wage gap has significantly decreased. However, challenges remain, particularly related to the employment rates of immigrants and individuals with low education. Policies are needed to provide education and training (e.g. language and job-specific skills) to vulnerable groups. The wage distribution may also need to widen at the lower end to create more jobs for less skilled workers.
Motivation
In the 1970s and 1980s, the Swedish labor market was noted for its extremely low unemployment rate. Today, unemployment is still relatively low, but high participation and employment rates, particularly among women and older workers, are more striking features that warrant international attention. Separate taxation of men and women, earned income tax credits, and pension reform have probably contributed to these developments.
Discussion of pros and cons
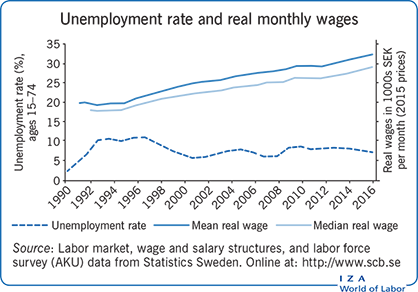
Since 2000, the unemployment rate in Sweden has been stable at around 6–8% with some cyclical variation, and real wages have increased steadily. Since the crisis year 1995, the mean real monthly wage has increased by 62% (2.5% per year) and the median real monthly wage has increased by 58% (2.3% per year).
Looking at these developments, it is useful to view them in a longer historical perspective. The Swedish unemployment rate was very low (1–3%) through the 1970s and 1980s, but a major financial and competitiveness crisis hit all sectors of the Swedish economy in 1991–1992. Exports and investment declined, the building industry collapsed, and the government had to make large cuts in public employment. This crisis brought unemployment above 10%, and it has since stabilized at the 6–8% level.
The 2008 global financial crisis hit Sweden primarily as an external aggregate demand shock, affecting exports and investment, while domestic sectors remained stable. Employment in industry declined sharply, but employment in the service sectors continued to grow and the Swedish economy recovered quite quickly. There was only a modest increase in unemployment. Behind these numbers, there are striking changes in labor force participation that must be considered in order to get a more complete picture of what has happened in the Swedish labor market.
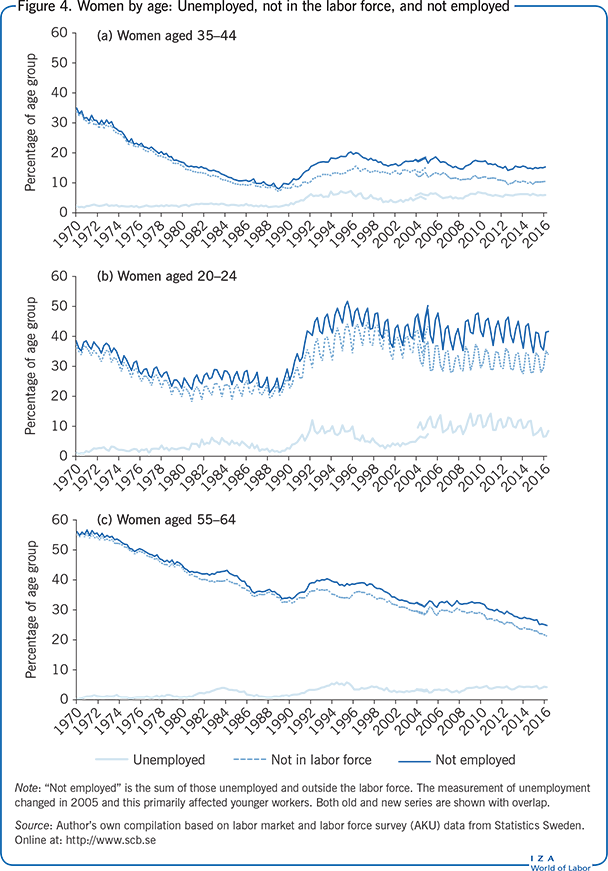
A good way to illustrate these developments is to plot the unemployed, those not in the labor force, and the sum of both—termed "not employed"—as percentages of the relevant population. Since there are big differences between men and women, graphs are separated by gender. The focus here is on the 20–64 age group, partly because of data availability and partly because individuals in age groups 16–19 and 65–74 participate in the labor market to a small extent. Notably, there was a change in the measurement of unemployment in 2005 as Sweden adjusted to international conventions. The most important change being that, since 2005, students looking for work during their studies have been counted as unemployed, which raised unemployment a couple of percentage points for young workers. Both the old and new series are shown with overlap.
Unemployment and labor force participation
Men
In the 1970s and 1980s, only 1–3% of the population of men aged 20–64 were unemployed, and only 10% were outside the labor force (Figure 1). The crisis that began in 1991 raised unemployment by about 6% and a similar number of workers left the labor force. Unemployment declined again after the crisis, but the proportion staying outside the labor force remained around 16% until 2006–2007. Aside from the well-known discouraged-worker effect, there were other factors contributing to this development: early retirement increased, there was increased enrollment in higher education, and some workers joined labor market programs, where they did not count as employed.
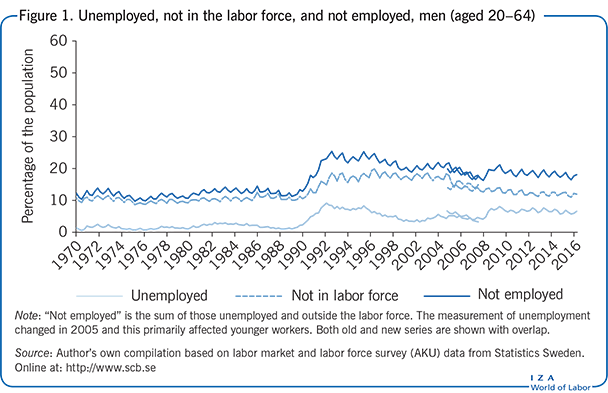
The effect of the 2008 crisis was very different. Unemployment increased once again, but by less, and there was no effect on labor force participation. Today, labor force participation is almost back to levels observed in the 1970s and 1980s.
So, what might explain these dramatic differences between the two crises? The 2008 crisis was mainly an external shock to exports; it did not affect the Swedish economy as broadly as the 1991 crisis did, and the economy recovered more quickly. Furthermore, the substantial decline in labor force participation in the 1990s had led to a raging political debate about “social exclusion” and arguments that policy should focus on employment rather than unemployment. The right-wing government that came to power in 2006 made a number of quick reforms that increased incentives to work, including introducing an earned income tax credit, reducing benefit levels, and limiting access to early retirement.
Behind this general picture, there are marked changes across age groups. Figure 2 shows the same information as Figure 1 for prime-age men (aged 35–44). The picture is very similar to the previous one, and shows that labor force participation is back to the level of the 1970s, but that unemployment for this group is now around 4% of the population, compared to 1–2% in the 1970s.
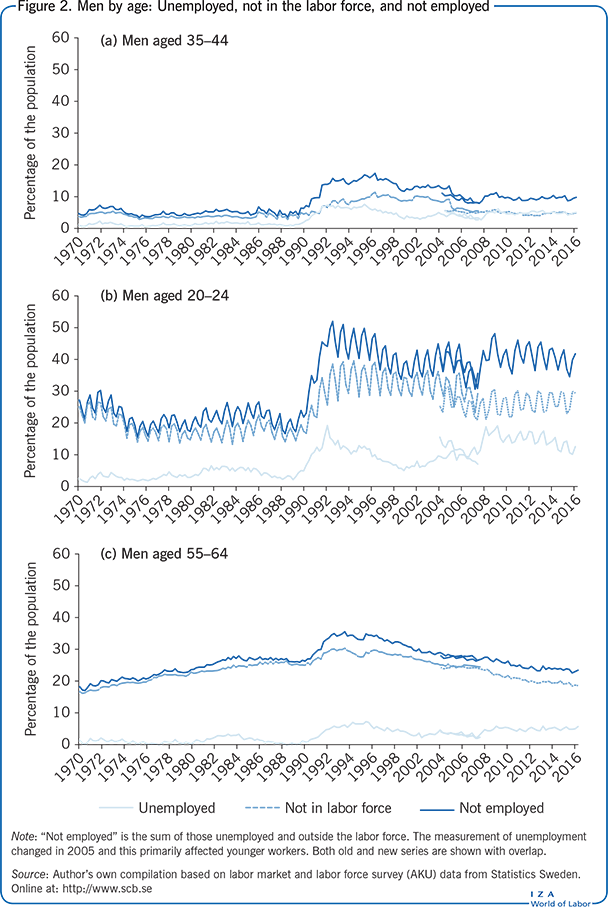
Young men (aged 20–24) have higher and more volatile unemployment (Figure 2). Labor force participation in this group is about ten percentage points lower now than it was in the 1980s. To a considerable extent, this reflects more time spent in education. Another development is that it has become common practice to take one or two “gap years” between upper secondary school and college, working temporary jobs, traveling, or working abroad.
Figure 2 shows there have been dramatic changes in the labor force participation of older men (aged 55–64). The trend toward decreasing labor force participation in the 1970s and 1980s was accelerated by the financial crisis in the 1990s, but this trend has reversed; since 1998, labor force participation of older men has increased steadily. Workers are healthier at later ages, and many jobs have become less physically demanding. Another factor contributing to this development was the 1999 pension reform. This reform made the pension system more actuarially fair, strongly increasing the incentives to work longer. There has also been an increase in the mandatory retirement age from 65 to 67 and, as mentioned above, reforms have made it harder to take early retirement. Unemployment developments have been similar for this group as for prime-age men.
Women
Labor force participation of women increased through the 1970s and 1980s, and by 1990 the female employment rate reached 83%, compared to 89% for men (Figure 3). This trend was reversed by the crisis, and the decline in labor force participation from 1990 to 1996 was similar to that for men (6–7% of the population). As with men, female labor force participation has recovered slowly, and is now almost back to the 1990 level. By 2015, the employment rate was 79% for women compared to 83% for men.
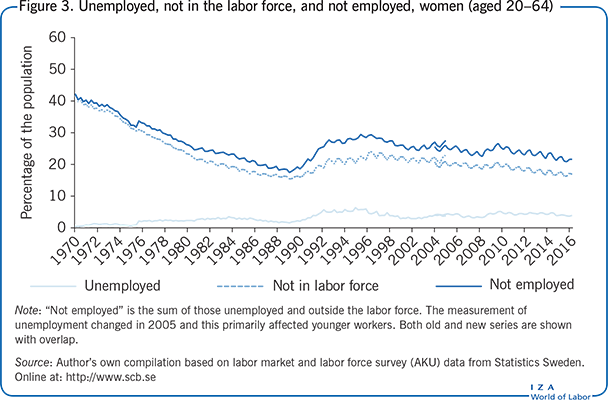
As with men, the unemployment rate of women is now more than twice as high as it was in the 1970s and 1980s. The unemployment cycles are also similar to those for men, but with smaller amplitudes since women tend to work in less cyclical industries such as trade, health care, and education. In fact, women were barely affected by the 2008 crisis, which mainly hit exports and investments.
Again, this larger picture masks important changes across age groups. Labor force participation of prime-age women has not quite recovered to its 1990 level, and labor force participation of younger women is about ten percentage points lower than in 1990 (Figure 4 and Figure 4). For older women, a strong trend of increasing labor force participation can be seen, which was only reversed temporarily in the crisis years 1992–1995 (Figure 4).
Summing up
There was a dramatic increase in women’s labor force participation until 1990, at which point the female employment rate was close to that of men, and since then the labor markets for men and women have developed similarly. The crisis in the early 1990s brought a dramatic deterioration both in terms of unemployment and labor force participation. Employment recovered in the late 1990s, but the unemployment rate stabilized at a level that is more than twice as high as that seen in the 1970s. In 2016, the unemployment rate (6.9% for age group 15–74) was lower than the EU average (8.6%), but Sweden no longer stands out among its peers. Several European countries, including the UK, Germany, and Austria, have lower unemployment rates.
Labor force participation recovered very slowly after the crisis in the 1990s, but now it is almost back to the level observed in 1990 for both men and women. However, there have been large differences in these trends across age groups, with young workers spending longer in school and taking gap years, while there has been a strong increase in labor force participation among older workers. In 2015, Sweden had the highest employment rate among EU countries (among workers aged 15–74), primarily due to high labor force participation among women and older workers [1].
Workers with low education and the situation of immigrants
Without an upper secondary school diploma it is hard to find a job in the Swedish labor market and the problems for this group of workers appear to be getting worse over time. The fraction of workers not employed among those without upper secondary school has increased from 61% in 2006 to 66% in 2016.
Sweden has had substantial immigration over the years. Decades ago, most immigrants came from European countries, and established themselves quickly in the Swedish labor market. More recently, many immigrants are refugees and family members of refugees coming from non-European countries. These immigrants have very varied backgrounds in terms of education, language skills, and experience. A large proportion of these workers has trouble finding jobs. Figure 5 shows unemployment and the fraction outside the labor force for men and women born in Sweden and abroad since 2005 for the age group 15–74.
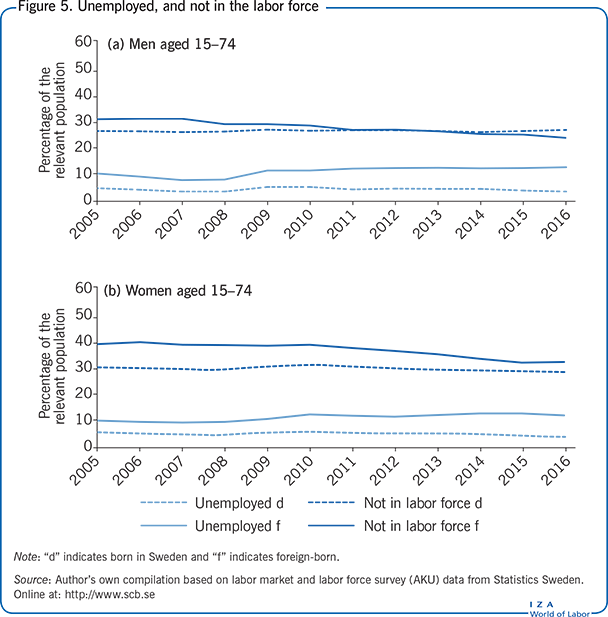
In 2015, 36% of foreign-born men and 44% of foreign-born women were unemployed or not in the labor force. Integration of immigrants has been high on the political agenda during this period, and some comfort can be taken by noting that there has been a decrease in the fraction of immigrants who are not in the labor force. In fact, the share of foreign-born men that is not in the labor force has fallen below the corresponding share of men born in Sweden, and the share of foreign-born women that are not in the labor force is approaching the corresponding share for Swedish-born women. Employment rates of immigrants have also increased since 2010, but the unemployment rate among immigrants is three times that among natives. Thus, most of the difference between foreign-born workers and those born in Sweden has to do with unemployment rather than labor force participation. Obviously, there is a lot of variation among the immigrants, with some groups doing very well and others having great difficulties establishing themselves (see [2] and [3]).
Wages
Figure 6 shows the 90th, 75th, 25th, and 10th percentiles of the wage distribution as percentages of the median wage (the 50th percentile). Since 1992, there has been some increase in wage inequality as the 90th percentile has increased from 145% to 158% of the median, and the 10th percentile has decreased from 82% to 76% of the median. Most of this change occurred in the period 1995–2001, and since 2001 the wage distribution has been very stable. This means that all wage-earners have received real wage increases similar to those shown for mean wages in the illustration on page 1. A bargaining system with strong coordination between employers’ organizations and unions has been in place since 1998 and has probably contributed to a rigid wage structure. By standard measures, Sweden has the most compressed wage distribution in the EU [1].
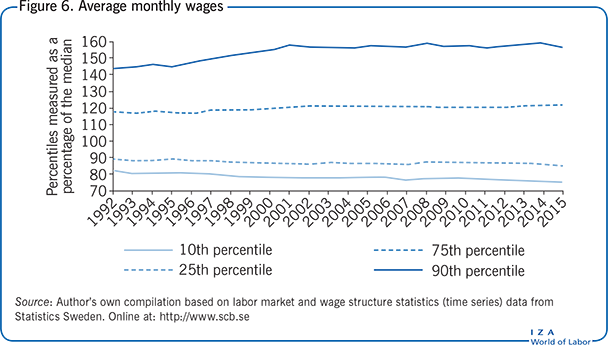
Figure 7 shows wages by education as a percentage of the wage of those with upper secondary school but no further education. In this dimension too, relative wages have been very stable. There is no legally binding minimum wage in Sweden, but union contracts cover most of the labor market, and these contracts typically stipulate minimum levels for wages. In fact, there appears to be a relatively high “wage floor” in Sweden as workers with no more than basic education (nine years) have a monthly wage that is 96% of the wage of those with upper secondary school.
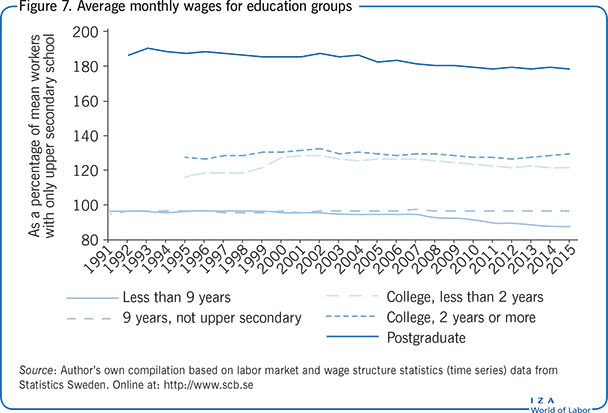
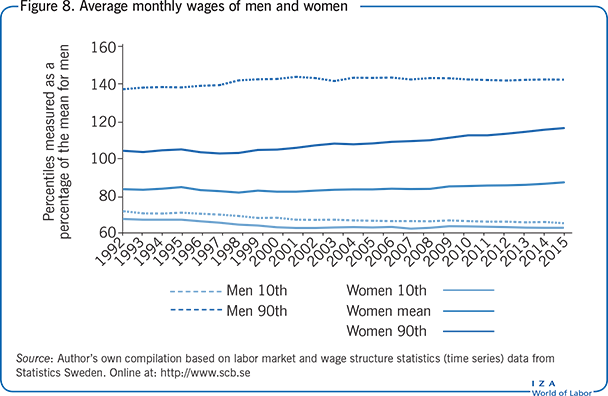
Figure 8 shows that women’s wages are slowly catching up. Relative to men’s mean wage, that of women has increased from 84% in 1992 to 88% in 2015. The figure also shows the top and bottom deciles for men and women relative to the mean wage of men. Unsurprisingly, men at their 90th decile earn much more than women at their 90th decile; but high-paid women are catching up quickly. Male–female differences at the 10th deciles of earnings are much smaller.
Limitations and gaps
The article focuses on the 20–64 age group because these workers are expected to have high labor market participation rates. The Swedish unemployment rate in the age group 16–19 is among the highest in Europe, which has led to a focus on youth unemployment in the political debate. However, measurement problems make comparisons across countries difficult. First, the great majority in the 16–19 age group is still in school, so the labor force is a small fraction of the population. Second, students looking for work have counted as unemployed since 2005, following now standard international practice. Even students who have a summer job waiting for them count as unemployed, provided they are not currently working. This means that differences in institutions and work habits make it hard to compare youth unemployment across countries [4].
Sweden has the most equal wage distribution in the EU and it has been very stable since 2001. Still, income differentials have increased [1]. This is partly due to the increased importance of capital income, but also due to increased income differentials between those who have a job and those who do not. This shows the negative side of reforms that have increased incentives for work by reducing benefits, making it harder to get early retirement and reducing taxes on earned income. However, a detailed analysis of income differentials is beyond the scope of this article.
Summary and policy advice
Sweden has the highest employment rate and the most equal wage distribution in the EU. Real wages are growing and the unemployment rate is relatively low (though no longer exceptional among EU countries). For the great majority, the labor market is working very well. The main challenge is how to get workers with weak credentials into employment. The incentives to work have been strengthened considerably in the last decade, but without adequate education, knowledge of the Swedish language, and other skills, it is very hard to get a job. Giving all workers proper education and training is the key to a well-functioning labor market. Some widening of the wage distribution at the lower end, possibly combined with tax breaks and subsidies, may also be necessary to create jobs for less skilled workers.
Acknowledgments
The author thanks Stefan Eriksson, Bertil Holmlund, and Oskar Nordström-Skans, an anonymous referee, and the IZA World of Labor editors for many helpful suggestions on earlier drafts. Previous work of the author contains a larger number of background references for the material presented here and has been used intensively [5]. Also, the presentation draws heavily on [1].
Competing interests
The IZA World of Labor project is committed to the IZA Guiding Principles of Research Integrity. The author declares to have observed these principles.
© Nils Gottfries
Differentiating between employment states
Employed: Those who answer that they worked one hour or more in the previous week as well as those on vacation, sick leave, or in the armed forces.
Unemployed: Someone who is not employed, but seeking and available for work. “Seeking work” means the person took specific actions to find a job.
Labor force: All employed and unemployed individuals taken together.
Not in the labor force: Those who are neither employed nor unemployed. Such individuals may be studying full time, retired, or taking care of the home and children. They may also be discouraged workers who want a job but have given up trying to find one.