Elevator pitch
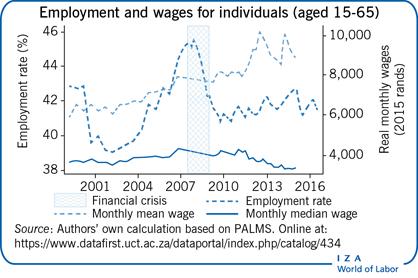
The South African economy was on a positive growth trajectory from 2003 to 2008 but, like other economies around the world, it was not spared from the effects of the 2008 global financial crisis. The economy has not recovered and employment in South Africa has not yet returned to its pre-crisis levels. Overall inequality has not declined, and median wages seem to have stagnated in the post-apartheid period. Labor force participation has been stable and although progress has been made, gender imbalances persist.
Key findings
Pros
The labor force has become more educated since 2000.
Average earnings increased in the period between 2000 and 2017.
While still substantial overall, the gender wage gap declined at the bottom of the wage distribution and at the mean.
Cons
A low employment rate and stable labor force participation have resulted in high unemployment, especially for youth.
Continued demand for skilled labor and a small tertiary educated labor force have led to very high wages at the top of the wage distribution and worsening wage inequality.
The median worker seems to be the loser in the South African labor market.
While pro-poor policies such as minimum wage laws raise wages at the bottom, high skill premiums have raised wages at the top, leaving median wages stagnant.
Author's main message
South Africa differentiated itself in the 20th century by embarking on a social experiment (grand apartheid) which intervened extensively in all facets of its citizens’ lives, including the labor market. With the demise of apartheid and reintegration into the world economy, South Africa's 21st century labor market dynamics increasingly resemble those of other economies, with a widening of the earnings distribution, particularly at the top. Nevertheless, there are still important vestiges of the late apartheid era, including a high unemployment rate, significant union power, and persistent racial and gender premia.
Motivation
South Africa remains one of the most unequal economies in the world with the level of inequality as measured by the Gini coefficient estimated at about 0.69 in 2014 (0 = complete equality; 1 = complete inequality) [1]. This inequality is a legacy of the apartheid era in which there was legalized discrimination based on racial classification. Access to education, employment, and remuneration received were all functions of this classification. The government separated its citizens into four broad groups, African (Black), Colored, Asian/Indian, and White. Economic differences between these groups have persisted since the end of apartheid. Consequently, South African social scientists still use this classification system, although it is now based on self-identification by respondents in surveys. Since 1994, the South African government has introduced several affirmative action policies to address racial and gender discrimination in the labor market. This article presents labor market trends, among others, in response to these policies.
Discussion of pros and cons
Aggregate issues
Education
The educational composition of the South African labor force has been changing over time (Figure 1). The average level of education increased from 2000 to 2017, as the share of individuals with primary education or lower fell and the share of individuals with completed secondary education, that is, 12 years of schooling (designated “Matric” in South Africa), grew.
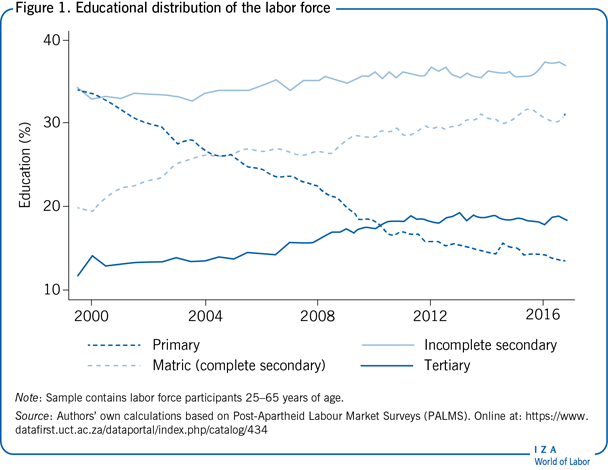
The share of individuals with primary education declined from 34% in 2000 to 14% in 2017. The share of individuals with incomplete secondary education (between 8 and 11 years of schooling) increased modestly by about 3 percentage points, while the share of individuals with 12 years of education increased from 19% in 2000 to 31% in 2017. The share of individuals with tertiary education increased from 12% in 2000 to 18% in 2017 and was stronger for women than for men. Between 2000 and 2017, the share of tertiary-educated men increased by 5 percentage points from 11% to 16%, while the share of tertiary-educated women increased by 9 percentage points from 12% to 21%.
Labor force participation
Figure 2 shows the labor force participation rate over the period 2000–2017, by gender and age. The aggregate labor force participation rate showed little movement during this time, dropping slightly from 59.8% in 2000 to 57.5% in 2017. This decline can be attributed to the effects of the global financial crisis. Labor force participation differs by age and gender. Among men aged 25–65 years, participation levels declined from 83.8% in 2000 to 79.3% in 2017. For women in the same age group, the female labor force participation rate in 2017 (64.7%) was slightly higher than in 2000 (62.4%).
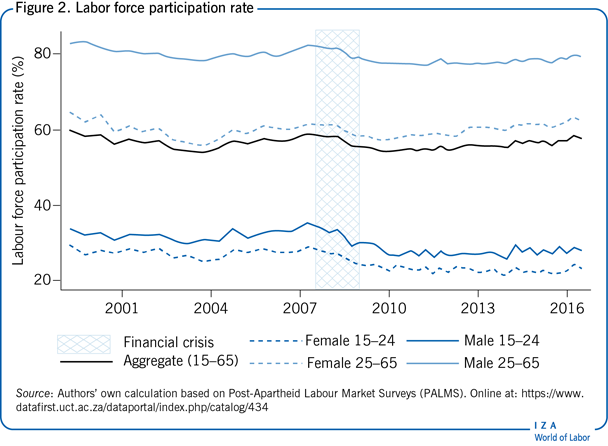
Female labor force participation increased in the 1990s before stabilizing in the 2000s [2]. Figure 2 shows a persistent gender gap in labor force participation, which stood at about 16% in 2017. Labor force participation is much lower for the 15–24 age group and the gender gap is smaller. Female labor force participation for this group declined from 29.3% in 2000 to 23.3% in 2017, while male participation declined from 33.9% in 2000 to about 28.1% in 2017. Additionally, the decline due to the financial crisis is much more evident for this group.
Unemployment
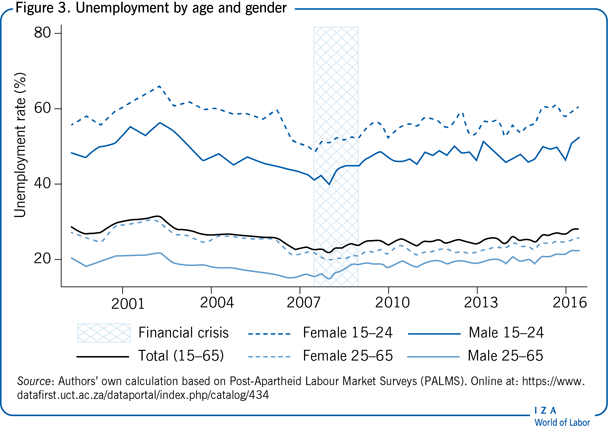
Unemployment is a global challenge and youth are the most vulnerable. In South Africa, a distressing 36.5% of youth aged between 15 and 29 are not in employment, education, or any form of training (NEET) [3]. Having such a big proportion of young people not engaged either in education or employment presents an obstacle for poverty and inequality eradication programs. Figure 3 presents the aggregate unemployment rate by different age groups and gender. Aggregate unemployment declined during the period of growth between 2003 and 2008, from a peak of 31.5% in 2003 to a low of 21.5% in 2008; it has been on the increase since, standing at 27.9% in 2017. The unemployment rate for the group aged 15–24 is more than twice the unemployment rate of the population aged 25–65. For the 15–24 age group, the female unemployment rate was at 58% in 2000, declined to a low of 48% in 2008, and increased to 60.5% by 2017. Male unemployment for this age group was at 52.3% in 2017, higher than the 2000 unemployment figure of 46.9%. The high unemployment among this demographic has led to a lot of discouraged youth, which is partially responsible for the low labor force participation rates among this group.
Wage developments
Aggregate developments
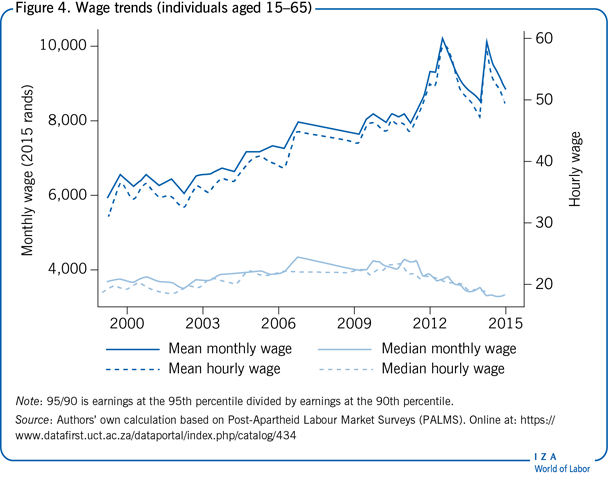
Figure 4 shows real wages for employees measured at the mean and median both monthly and hourly. Wages in nominal rands are deflated by the Consumer Price Index to obtain real wages (in constant 2015 South African rands). Some features of Figure 4 stand out. First, the mean wage exceeds the median wage for both hourly and monthly wages. This reflects the very high wages for top earners and the high wage inequality in South Africa. Second, both median and mean wages were on an upward trajectory, especially before 2012, but the rate of growth of mean wages is higher than that of median wages. While average real wages increased by 49.3% from 2000 to 2017, median wages increased by only 16.9% between 2000 and 2011 and have been on a downward trend since. The South African labor market has been experiencing skill-biased growth and median earners have been the losers during this period [1], [4], [5], [6].
Wage inequality
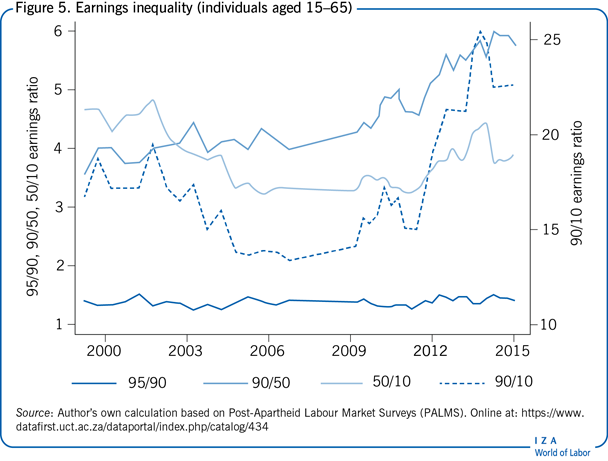
The South African labor market is challenged by the presence of a large low-skilled labor force and small high-skilled labor force. This situation has led to very high returns to skilled labor, thus increasing wage inequality. Figure 5 shows the earnings ratios for pairs of individuals at different points of the monthly earnings distribution. Trends for the 95/90 ratio (which is earnings at the 95th divided by earnings at the 90th percentile), the 90/50, the 90/10, and the 50/10 ratios are presented. As seen, there have been big changes in inequality at the top and the bottom of the wage distribution. The 90/50 ratio continually increased from 2000 to 2015. In 2000, employees at the 90th percentile earned about four times more than those at the median; by 2015, they were earning about six times more. The 90/10 and 50/10 ratios declined between 2002 and 2008 but the trend reversed after 2008. Labor market policies such as minimum wage legislation for the vulnerable industries of agriculture and domestic work have been credited with this decline [6].
Wage ratio by race
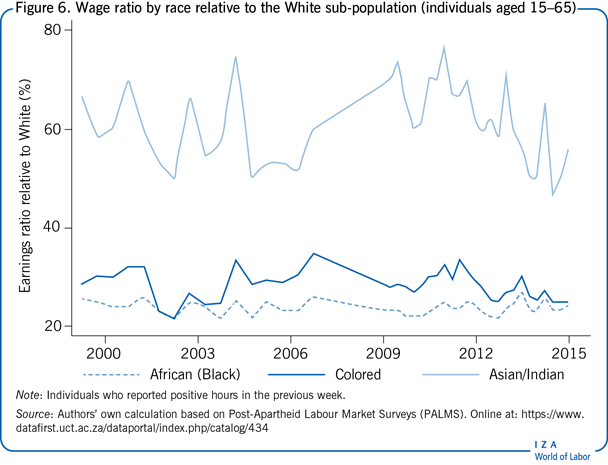
Figure 6 plots the wage ratio by race relative to White South Africans. The figure shows that the legacy of apartheid persists with the White population group still earning significantly more than all other groups. Among the employed in 2017, 74% were African (Black), 11% were Colored, 3% were Asian/Indian, and 12% were White. Though Black South Africans are the majority population group, they earn only about 25% of what White South Africans earn. Despite some fluctuations, it is striking that there is not much movement between 2000 and 2015—this is true also of the relative earnings of Coloreds and Asians/Indians.
The difference in wages is partly due to human capital differences stemming from apartheid policies. Through the implementation of The Bantu Education Act in 1953, for example, black students received inferior education to ensure a continued supply of unskilled labor. More than two decades after the demise of apartheid and despite the overall increase in average years of education, the quality of education in historically black schools remains poor. Additionally, Black and Colored South Africans who make up more than 85% of the population are still overrepresented in low-skilled employment.
Female/male wage ratio
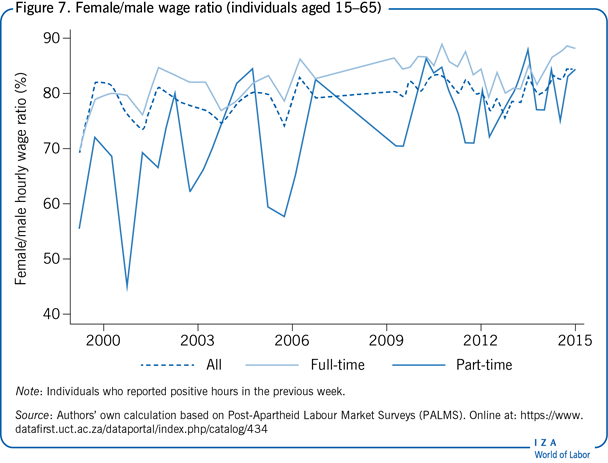
Figure 7 shows median female pay as a share of median male earnings. When considering all employees, women still earn less than men, although the wage ratio has risen, from about 79% in 2000 to slightly over 84% in 2017. When considering only full-time employees, the ratio of female-to-male pay in 2017 was 88%. The biggest increase in the female-to-male wage ratio is seen in part-time work, where the ratio increased from about 72% in 2000 to 84% in 2017. Part-time wage employment is female-dominated and women in part-time work are more likely to have less education than full-time employed women and they are more likely to work in low-pay occupations such as domestic work [7].
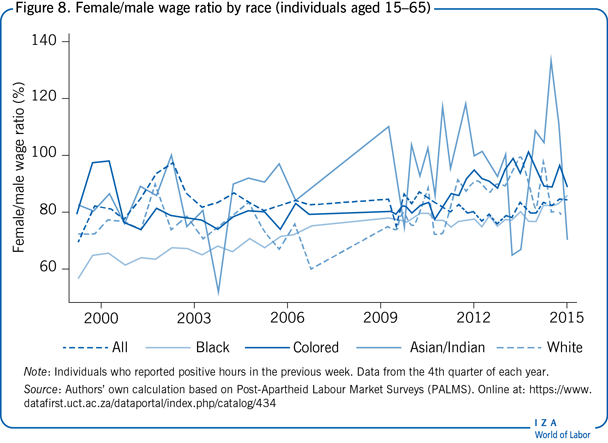
Implementation of minimum wages in the domestic and agricultural sectors through the Basic Conditions of Employment Act 75 of 1997 has contributed to the declining wage gap. However, important to note is that this is a simple comparison of female and male (median) pay per hour and does not consider differences in pay due to composition effects such as the level of education and industry or occupation. Studies show that controlling for composition effects results in a larger adjusted gender wage gap [8]. Figure 8 shows the female-to-male wage ratio by race and reveals that the greatest increase in the ratio has occurred among black workers.
Non-union/union wage ratio
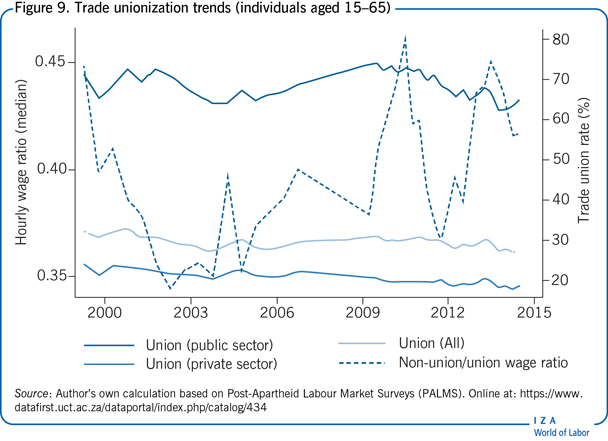
Trade union membership remains substantial in the post-apartheid period and wage premiums associated with belonging to a union are high. The share of wage employees in a trade union was about 32% in 2000 and dropped slightly to 28% in 2015 (Figure 9). Union coverage rates are however higher in the public sector (about 65% of public sector employees were unionized in 2015) than in the private sector (only 19% of private sector employees were unionized in 2015). The gap in hourly median wages between union and non-union workers is quite high with union workers earning more than twice the non-union workers’ hourly wage.
Limitations and gaps
When analyzing trends in the South African labor market, data quality issues that stem from changes in the measurement instrument, as well as missing and imputed earnings, must be considered. For example, the wage trends in the most recent Quarterly Labour Force Surveys (QLFSs) exhibit many breaks that stem from imputations done on the earnings variable [9]. This makes it difficult to interpret inequality trends after the second quarter of 2012. Additionally, high non-response rates and underreporting of income by high wage earners makes it difficult to examine top income inequality using Labour Force Surveys [10]. There is thus a great need to make administrative tax data more freely available.
Summary and policy advice
South Africa carries with it a rather unique recent social history due to the legacy of apartheid. The impact of this period is evident in today's labor market, with dramatic race earnings and educational gaps persisting despite direct governmental intervention. There is also a clear problem related to youth unemployment that has remained prevalent for years. Education policies have raised the average human capital of new entrants to the labor market, but not to the extent it has alleviated the shortage of high-skilled workers. Likewise, the lack of more dynamic labor demand is reflected in the very high unemployment rate and the absence of any wage growth at the median. Government labor market policy has favored unions and raised wages in the bottom quartile; this approach has inhibited the growth of low-wage work and has failed to reduce unemployment. It is unlikely that the current labor market environment will substantially reduce unemployment in the next decade.
Acknowledgments
The authors thank anonymous referees and the IZA World of Labor editors for many helpful suggestions on earlier drafts. Previous work of the authors contains a larger number of background references for the material presented here and has been used intensively in all major parts of this article (Wittenberg, M. Analysis of Employment, Real Wage, and Productivity Trends in South Africa since 1994. Conditions of Work and Employment Series, 45. Geneva: International Labour Office, 2014; Wittenberg, M. “Wages and wage inequality in South Africa 1994–2011: Part 2—Inequality measurement and trends.” South African Journal of Economics 85:2 (2017): 298–318).
Competing interests
The IZA World of Labor project is committed to the IZA Code of Conduct. The authors declare to have observed the principles outlined in the code.
© Jacqueline Mosomi and Martin Wittenberg