Elevator pitch
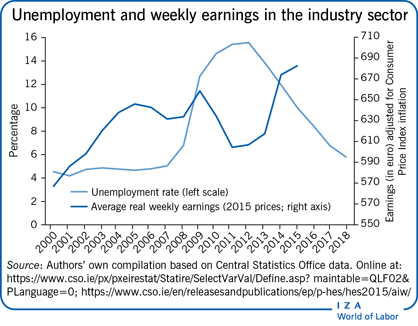
Ireland was hit particularly hard by the global financial crisis, with severe impacts on the labor market. Between 2007 and 2013, the unemployment rate increased dramatically, from 5% to 15.5%, and the labor force participation rate declined by almost five percentage points between 2007 and 2012. Outward migration re-emerged as a safety valve for the Irish economy, helping to moderate impacts on unemployment via a reduction in overall labor supply. As the crisis deepened, long-term unemployment escalated. However, since 2013, there is clear evidence of a recovery in the labor market with unemployment, both overall and long-term, dropping rapidly.
Key findings
Pros
Unemployment has been on a steep downwards trajectory since 2013.
Migration acted as an important safety valve for the Irish economy in the aftermath of the crisis, whereby increases in unemployment led to rising emigration, thus alleviating the potential impact on the unemployment rate.
Labor force participation rates have stabilized after experiencing substantial falls during the crisis years.
Cons
Issues around future sources of labor supply are beginning to emerge.
In terms of unemployment, young men (aged 15–24) were hit particularly hard by the recession due to their high concentration within the construction sector.
Although the labor market has largely recovered since the crisis, Brexit constitutes a major challenge to the economy and labor market.
Author's main message
In the early 2000s, Irish growth was fueled by a property, credit, and construction boom. The global financial crisis in 2008 shattered this growth model. Between 2007 and 2012, the unemployment rate soared from 5.0% to 15.5%, despite outward migration helping to moderate some of the impact. Recovery has been underway since 2013, but uncertainty about the sources of future labor supply remains a salient issue. Migration could offer a means of alleviating growing labor supply concerns. Furthermore, Brexit represents a major risk to the economy with likely uneven impacts across the labor market.
Motivation
As a small, open economy, the business cycle is particularly pronounced in Ireland. The openness of the economy also includes the labor market, and migration has traditionally played an important role in dampening the peaks and troughs of the cycle. Although the unemployment rate rose to double-digit figures during the Great Recession, the rate would have been much higher if not for emigration. At the same time, if immigration had not taken place during the Celtic Tiger growth period, the country would have faced significant wage pressures that would have impacted the country's competitiveness and ultimately its growth rates during this period.
Discussion of pros and cons
Aggregate issues
The past 20 years have seen the Irish economy experience an unprecedented boom and a spectacular bust. From a relatively low standard of living within the EU15 (Austria, Belgium, Denmark, Finland, France, Germany, Greece, Ireland, Italy, Luxembourg, the Netherlands, Portugal, Spain, Sweden, and the UK) in the early 1990s, the following decade saw the standard of living in Ireland converge rapidly to the EU15 average. Between 1997 and 2007, real GNP expanded at an average rate of 6% per annum. The economic success of the Celtic Tiger years was mirrored by developments in the labor market. The unemployment rate fell dramatically in the 1990s, from 15% to just over 4% in the early 2000s, and substantial immigration helped to relieve labor market pressures.
Until 2000, growth was underpinned by an expansion in world trade and a rapid increase in world market share for Irish exports. However, rising incomes and Ireland's relatively young population of household formation age (the age where people set up independent households), together with the increased availability of low-cost finance as a result of European Monetary Union (EMU) membership, led to a boom in the building and construction sector. In contrast to the 1990s, where growth was driven by exports, the housing boom was the driving force for economic growth over the following years. By around 2003 domestic savings were no longer sufficient to fund the housing boom and the banking sector continued to fund the property sector by foreign borrowing. In addition, public finances became increasingly dependent on transaction taxes in the property sector [1].
When the global financial crisis hit in 2008, Ireland was particularly exposed: this was intensified by a collapse in property prices and the construction sector, followed by severe difficulties in the banking sector [2], [3]. The contraction in economic activity was dramatic, with a cumulative fall in real GNP of over 12% in 2008 and 2009. The full gravity of the problem with the banking system was not fully realized until the autumn of 2010. The revelation of these problems saw Ireland's access to international funding drying up. This, combined with the large fiscal deficit that emerged in the wake of the crisis, led the government to turn to the European Commission, the European Central Bank (ECB), and the International Monetary Fund (IMF), known as the “Troika,” in late November 2010 for assistance. Ireland exited the assistance program that was agreed with these three institutions in 2013. Recovery has been underway since then. The economy is currently one of the fastest growing in the EU, and there has been a remarkable improvement in most labor market indicators since 2013. However, there are several challenges facing the domestic economy that cannot be underestimated. This includes the uncertainty around future sources of labor supply and dealing with the potential outcomes of Brexit.
Unemployment—Aggregate, by gender, and by age
Figure 1 shows developments in Ireland's unemployment rate between 2000 and 2018, overall and separately by gender and age. Three distinct periods can be identified: 2000−2007, 2008−2012, and 2013−2018, each of which reflect the country's variable economic growth over the entire period.
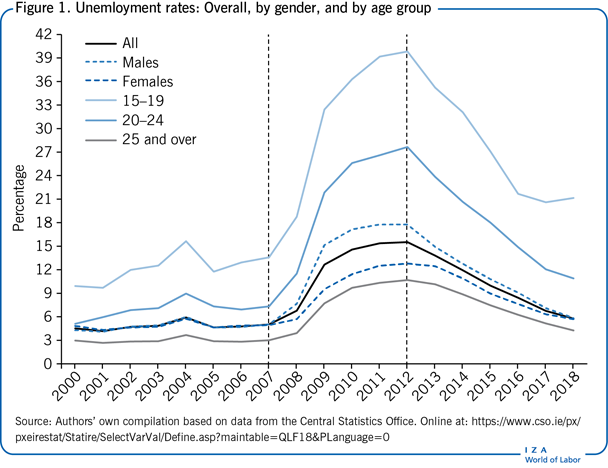
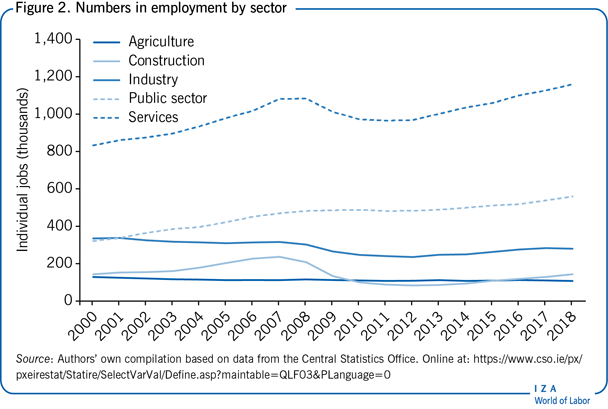
The rapid economic growth that took place in Ireland during the mid to late 1990s resulted in the country's unemployment rate falling to a low of 4.2% in 2001, the lowest on record in modern history. Ireland's unemployment rate remained low between 2001 and 2007, averaging 4.9%. As indicated already, Ireland's economic expansion during this period was largely driven by the property sector. The impact that this specific type of growth had on employment in the construction and services sectors can be seen in Figure 2.
Between 2001 and 2007, the youth unemployment rate (ages 15−24) was, not surprisingly, above average, particularly for those aged 15−19 years, where the rate averaged 12.6%. Nevertheless, at less than 10%, Ireland's youth unemployment rate during this period was much lower compared with the rate in some other OECD economies.
The effects of the economic crisis on the country's labor market were severe. As can be seen in Figure 1, the overall unemployment rate increased from 5% in 2007 to 15.5% in 2012.
Men, in particular, were severely affected by the downturn because of their high concentration in the construction sector prior to the recession. Between 2007 and 2012, 153,300 construction sector jobs were lost (Figure 2), making it the sector that experienced the largest number of job losses over the period. This, combined with reductions in the numbers employed in both agriculture and industry, resulted in the male unemployment rate rising to 17.8% in 2012. While the female unemployment rate also rose between 2007 and 2012 (where it peaked at 12.8%), the increase was not as great as that for men. This is due to the over-representation of women in sectors that were less exposed to the downturn [4], in particular, health, which is predominately in the public sector that continued to expand throughout the downturn, as shown in Figure 2.
Young people were also exposed to the collapse in construction. In 2007, the construction sector accounted for 17% of employment among those younger than 25, and almost one-third of employment for men younger than 25 [4]. This, along with the concentration of their employment in other cyclically sensitive sectors, such as manufacturing and wholesale and retail, resulted in the unemployment rate of those aged 15−19 rising sharply to 39.8% in 2012 and to 27.7% for those aged 20−24. Relative to younger people, those aged 25 and over were less exposed to job losses in the construction sector and, consequently, their unemployment rate did not increase by as much over the recession: it rose from 3% in 2007 to 10.7% in 2012.
The Irish economy began growing again in 2010; however, the recovery was quite muted and has only gathered momentum since 2013. Since then, the unemployment rate has fallen quite rapidly: as of 2018, the overall rate, and also for men and women, stood at 5.8%. Thus, the large gap that emerged between the male and female unemployment rates during the Great Recession (17.8% and 12.8% respectively) has closed quite considerably during the recovery period. Youth unemployment rates have also fallen during the recovery: in 2018, the rate was 21.2% for those aged 15−19 and 10.9% for those aged 20−24. However, while there has been considerable improvement in the labor market, the unemployment rate is not as low as it was before the crisis.
Labor force and participation developments
Gains and losses in employment and unemployment only partially shape the size and structure of the labor force. Migration and changes in participation have also been crucial to the evolution of labor supply.
Migration flows are particularly sensitive to economic conditions. Figure 3 shows net migration as a share of the labor force from 2000 to 2018. Comparing this with the evolution of the unemployment rate shows that there is a common cyclicality between the two, with outflows tending to increase when the unemployment rate is high and vice versa. Essentially, when unemployment rises, some people decide to emigrate rather than stay in Ireland and be unemployed, thus preventing unemployment from rising further. In this sense, migration acts as a “safety valve” or an alternative to unemployment. In the second half of the 1990s, strong economic growth and a tighter labor market encouraged inflows into the country, about half of whom were non-Irish nationals. The majority of migrants during this period were highly skilled. With the enlargement of the EU in 2004 creating a much larger pool of labor, there was a further increase in net immigration to Ireland, with the bulk of the net inflow being non-Irish citizens rather than returning emigrants.
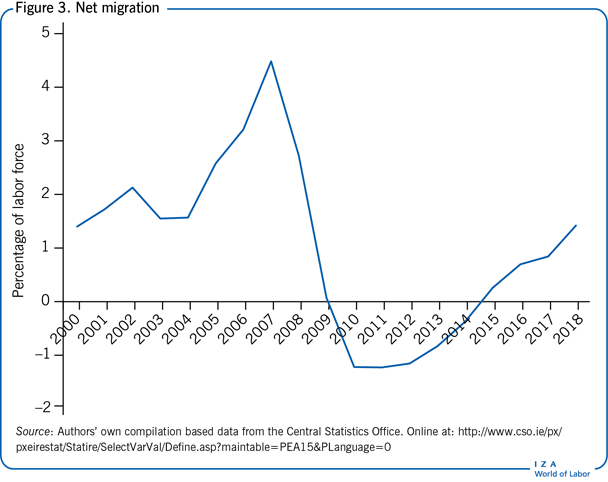
Research shows that immigrants generally earn less than comparable natives [5] and are less likely to be in high-skilled occupations [6]. Migrants were also severely affected by the crisis. A study from 2012 shows that employment among immigrants fell by 20% between 2008 and 2009, compared with 7% for natives [7]. The study also finds that this was not just a construction-industry effect; job losses were relatively higher for immigrants across most sectors. The Great Recession led to a reversal of net immigration of both Irish nationals and non-nationals starting in 2010. Following the recovery of the Irish economy, net emigration rates began to decline in 2013; by 2015 there was again a small amount of net immigration and net inflows have been increasing since.
Figure 4 shows the overall labor force participation rate and separately by gender for Ireland and the EU28. In the 1980s, Ireland's female labor force participation rates were among the lowest in the EU. However, factors such as rising educational attainment and more favorable labor market conditions led to the female participation rate rising by around one-third over the course of the 1990s. In the early 2000s, the overall female participation rate converged toward the EU average and even surpassed it in the years before the crisis. In the wake of the crisis, participation rates fell, particularly for men and younger people, in line with the severe job losses in construction. Many of the younger people who exited the labor force and stayed in Ireland returned to education [8]. In recent years participation rates have stabilized and are currently above the EU average.
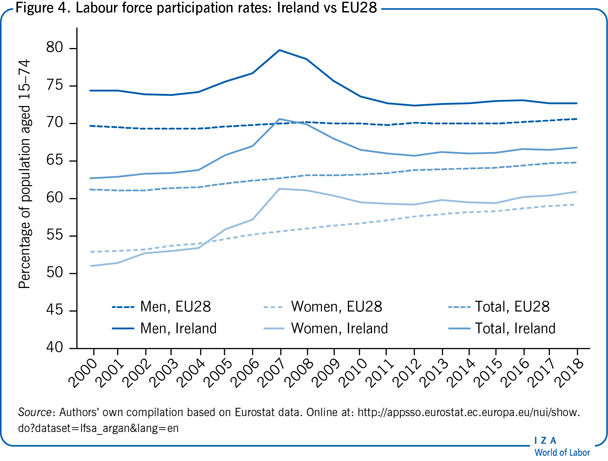
Looking to the future, in the context of a rapidly growing economy with unemployment on a strong downwards trajectory, issues about potential sources of labor supply are becoming more prevalent. The aggregate labor force participation rate is currently above the EU average for both men and women. Issues related to affordable childcare are important considerations when designing policy to further increase the female labor force participation rate. Immigration offers another possibility to increase Ireland's labor supply. Although Brexit constitutes a challenge for Ireland, it is possible that some EU migrants who might otherwise have gone to the UK, migrate to Ireland instead.
Potential implications of Brexit on the labor market
One of the biggest challenges facing Ireland, at present, is Brexit and the possible implications of a no-deal Brexit. While there is still uncertainty surrounding the nature of the UK's withdrawal from the EU, there is some consensus around the types of sectors in Ireland that may be hardest hit. The most affected sectors, in terms of employment, are likely to be agriculture and food, textiles, and traditional manufacturing [9], [10]: agriculture and food exports could fall by 17%, while exports of textiles, paper, and wood could fall by 15% [9].
Figure 5 shows the educational attainment of the two groups of workers that are likely to be most affected by Brexit: those in occupations related to agriculture and food and those in occupations related to textiles, wood, and paper. For comparison, the educational attainment of all other workers is also shown. There are striking differences between the education levels of the two “at-risk” groups compared to the rest of the workforce. Just 15% of agriculture and food workers and 18% of textiles, paper, and wood workers have higher education, compared to 51% for all other workers. The relatively low educational attainment of the two at-risk groups is potentially concerning as these workers may find it difficult to get alternative jobs, upskill, or change occupations in the event of adverse consequences for the sectors in which they work.
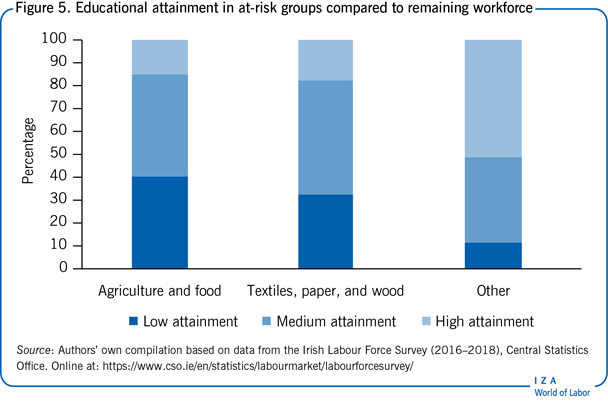
Other differences emerge with respect to age and gender. The average age of workers in the agriculture and food occupations is 48 years, while for textiles, paper, and wood it is 45 years. This compares with a younger average age of 41 years for the rest of the workforce. This older average age would also make it more difficult for these two at-risk groups to find new jobs in the event of adverse employment effects associated with Brexit. With respect to gender, the two groups particularly susceptible to Brexit-related risk are predominantly male: 87% of agriculture and food workers and 72% of textiles, paper, and wood workers are male compared to approximately 50% for all other workers.
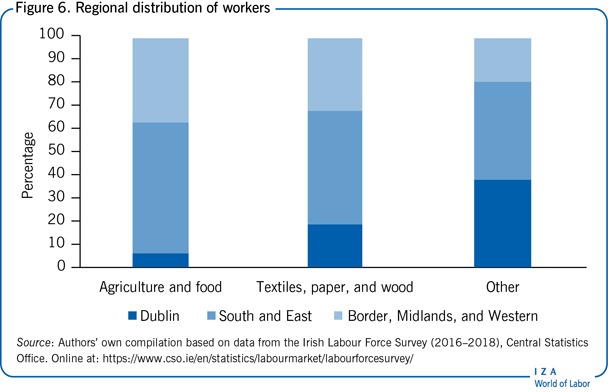
Figure 6 highlights significant regional distribution differences between the two at-risk groups of workers and the rest of the workforce. A disproportionately high percentage of workers in the at-risk groups are located in more rural locations in Ireland than in urban centres like Dublin. Specifically, approximately 37% of agriculture and food workers and 32% of textiles, paper, and wood workers are located in the Border, Midlands, and Western (BMW) region, compared to just 20% of all other workers.
Household income, income inequality, and deprivation
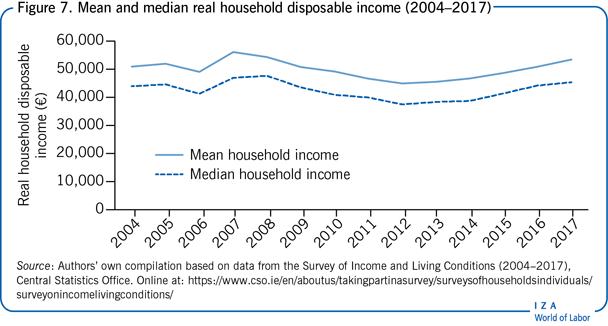
Data available from the EU Survey of Income and Living Conditions (EU-SILC) allows an examination of the changes in household income and income inequality. Figure 7 shows mean and median real household disposable income over the period 2004–2017. Mean household income peaked at approximately €56,000 in 2007, while median income peaked at €48,000 in 2008. However, following the onset of the global financial crisis, there was a prolonged period of decline in real household disposable incomes, so that by 2012 household income was approximately 20% lower than its pre-crisis level. Evidence of an economic recovery is apparent from 2013 onwards, as incomes started to increase. This rate of increase has continued up to 2017, with most recent estimates, for both mean and median incomes, now approaching their pre-crisis levels.
The Gini coefficient is a widely used measure of income inequality, with higher coefficients indicating greater inequality. Figure 8 shows the Gini coefficient for Ireland from 2004 to 2017. The Gini coefficient in Ireland has been very stable over the last two decades [11], [12], rarely moving outside the 31–32 range. A notable exception occurred in 2009, which was the year in which the full effects of the economic recession were beginning to take effect. As shown in Figure 8, the Gini coefficient in 2009 fell to 29.3, its lowest level since 1980. From 2008 to 2009, there was a significant decrease in the share of income among individuals in the highest decile, while at the same time the lower deciles experienced either no change, or a slight increase. Therefore, this led to the observed decline in the Gini coefficient from 2008 to 2009 [9]. However, this was a very short-lived effect. By the following year, 2010, the Gini coefficient had increased to its previous range of 31–32, and has been relatively stable since then.
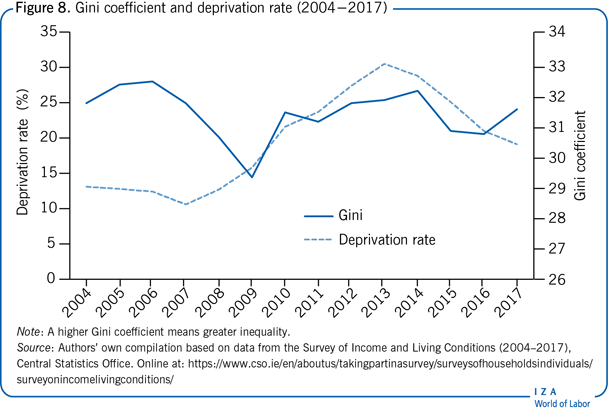
Also shown in Figure 8 is the deprivation rate in Ireland over the period 2004–2017. A household is considered deprived if it is unable to afford certain goods or services that are considered the norm for other people in society. Figure 8 shows a sharp increase in the deprivation rate with the onset of the recession. In 2007, the deprivation rate was 11%. However, by 2013 this had almost tripled to 31%. This highlights the severity and prolonged nature of the economic downturn during this period. From 2013 onwards, the deprivation rate started to decline as the economy improved. While still not as low as the pre-recession levels, the deprivation rate in 2017 had reduced substantially to 19%.
Limitations and gaps
The biggest limitation in examining developments in the Irish labor market between 2000 and 2018 is the absence of a consistent individual-level earnings series. The Irish Labour Force Survey only contains income data from 2009 onwards, and is available for employees only. A number of other earnings series collected by Ireland's national statistical collection agency, the Central Statistics Office (CSO), were discontinued just prior to the Great Recession. In 2017, the CSO produced a new historical earnings series covering the period 1938−2015. However, this publication is based on earnings surveys that have changed over the years and, consequently, the earnings data are not directly comparable due to methodological, definitional, and classification differences.
Using EU-SILC data, it is feasible to examine changes in household income and income equality, as has been presented in this article. It is not feasible, however, to examine developments in entrepreneurship and start-ups because either the data do not exist or are not available for the complete 2000−2018 time period.
Summary and policy advice
After a period of substantial economic growth, the Great Recession rocked Ireland's economy. Unemployment rates rose dramatically, with younger men hit hardest by the collapsing construction sector. Net migration flipped from positive to negative during the recession, which helped moderate the size of the unemployment pool via reductions in labor supply. Since 2013, the economy has recovered considerably. Looking ahead, two major challenges seem most pertinent given the current state of the Irish labor market: the potential impact of Brexit and future sources of labor supply.
Brexit represents one of the biggest challenges currently facing Ireland. While there is much uncertainty, both political and economic, around Brexit, it is known that Ireland is particularly exposed and that any type of Brexit will have negative and potentially far-reaching impacts for the economy and labor market. In any Brexit scenario, employment in Ireland will be lower than if the UK were to stay in the EU. Certain sectors and regions are likely to be disproportionately impacted by Brexit and active labor market programs need to be explored for those that are most exposed to the negative impacts of Brexit. In parallel to this challenge, issues related to future sources of labor supply are beginning to emerge as the economy continues to experience rapid growth. Migration, whether enticing those who emigrated during the Great Recession to return or attracting new immigrants, is likely to offer a flexible option to policymakers in dealing with Ireland's future labor supply challenge.
Acknowledgments
The authors thank an anonymous referee and the IZA World of Labor editors for many helpful suggestions on earlier drafts. Previous work of the authors contains a larger number of background references for the material presented here and has been used intensively in all major parts of this article [4], [11], [12]. Version 2 of the article introduces new figures and updates existing figures and content to 2018, and includes a detailed discussion of the potential consequences of Brexit on some components of the labor market.
Competing interests
The IZA World of Labor project is committed to the IZA Code of Conduct. The authors declare to have observed the principles outlined in the code.
© Adele Bergin, Elish Kelly, and Paul Redmond