Elevator pitch
The youth population bulge is often mentioned in discussions of youth unemployment and unrest in developing countries. But the youth share of the population has fallen rapidly in recent decades in most countries, and is projected to continue to fall. Evidence on the link between youth bulges and youth unemployment is mixed. It should not be assumed that declines in the relative size of the youth population will translate into falling youth unemployment without further policy measures to improve the youth labor market.
Key findings
Pros
In most developing countries the youth share of the working-age population is now substantially lower than 40 years ago.
Growth of the youth population in most middleincome countries is zero or negative.
The youth share of the working-age population is much lower in high-income than in low-income countries, but youth unemployment is not lower.
The relative size of the youth population has declined in recent decades in high- and low-income countries, but youth unemployment has not.
Countries in the Middle East and North Africa are not experiencing dramatic youth population bulges, so that is unlikely to be a major factor in high youth unemployment or political unrest.
Cons
Many poor countries, especially in sub-Saharan Africa, continue to have high growth rates of the youth population.
High youth growth rates are projected to continue in sub-Saharan Africa for several more decades, rising by 3.9 million a year and reaching 5.2 million a year over 2025–2030.
Most of the literature finds that larger youth cohorts in high-income countries have worse labor market outcomes.
More recent data confirm that larger youth cohorts have worse labor market outcomes in high-income countries, though the evidence for developing countries is weak or mixed.
Author's main message
The youth population bulge is not as important in explaining youth unemployment as is often suggested. While the youth population has grown rapidly in many countries, the youth share of the working-age population was higher 40 years ago than it is today in most developing countries. This includes North Africa, where the youth bulge has been a focus of attention. While policymakers should understand the demography of youth labor markets, they should not expect that declining youth cohorts can take the place of policies such as education and labor market flexibility that will more directly improve youth labor markets.
Motivation
Youth unemployment is a major policy concern. Global youth unemployment is estimated at 12.6%, with 73 million young people unemployed [1]. A “youth bulge” is often cited as a contributor to political unrest [2], based on the belief that large youth cohorts create high youth unemployment. But direct evidence linking the two is limited, and the ratio of youth to the working-age population has been declining. Thus policies to reduce youth unemployment need to focus on increasing labor market flexibility and improving education rather than expecting the declining youth population to ease youth unemployment.
This survey of the literature analyzing links between youth demography and youth unemployment in high-income countries uses UN population estimates to analyze global trends in youth demography and links these data on youth unemployment from the International Labour Organization (ILO) Key Indicators of the Labour Markets (KILM 8th edition) database.
Discussion of pros and cons
Studies on the relationship between cohort size and labor market outcomes have often found that larger cohorts experience worse labor market outcomes. The consensus of studies that focused on the early labor market experiences of baby boom cohorts entering the labor market in the 1960s and 1970s in North America and Europe was that larger cohorts caused some combination of lower entry-level wages and higher unemployment relative to older workers [3], [4], [5].
A study combining variation across 15 Organisation for Economic Co-operation and Development (OECD) countries and variation across time over 1970–1994 found that a higher youth share of the working-age population (“cohort crowding”) led to higher youth unemployment relative to adult unemployment [6]. An increase in the youth share of the working-age population in US states reduced the unemployment rate for both youths (ages 15–24) and prime-age adults (ages 25–54) [7]. Drawing on a search model of the labor market, the study attributed this surprising finding to the fact that a high fraction of young people in the labor force increases labor market flexibility.
There has been less research on the labor market impact of cohort size in developing countries. One study found that being in a large cohort had negative effects on the labor market outcomes of unskilled Brazilian men [8]. Other studies showed that the youth proportion of the working-age population has declined in many developing countries, a result of rapid fertility decline [9]. An analysis of 93 countries found little evidence that larger youth cohorts had worse labor market outcomes. These issues are explored below in greater detail, using more recent data for a larger set of countries.
Measuring the youth bulge
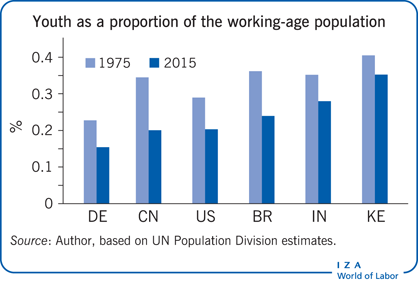
One measure of the youth bulge is the proportion of young people in the working-age population, typically measured as the ratio of the population ages 15–24 to the population ages 15–64 [6], [7]. The range of estimated youth ratios for 2015 is very large, from 15% in Spain to almost 40% in the Democratic Republic of the Congo.
The youth ratio has declined substantially in many developing countries since 1975. Vietnam went from having one of the highest youth ratios, at 38%, to a projected 24% in 2015. Brazil, China, Indonesia, and Thailand had similar large declines, reflecting rapid declines in fertility [10]. In low-fertility countries such as Japan, Russia, and Spain, youth make up only around 15% of the working-age population, also with large declines between 1975 and 2015.
Many sub-Saharan African countries still have a high fertility rate, creating a young population age structure. In Congo, Ethiopia, Nigeria, and Tanzania, the youth ratio, already around 35% in 1975, has increased since. While the youth ratio elsewhere has declined since 2000, youth will still make up more than a third of the working-age population in 2030 (Figure 1). Sub-Saharan Africa’s youth population is increasing by 3.9 million people a year, for a projected rise to 5.2 million a year in 2025–2030.
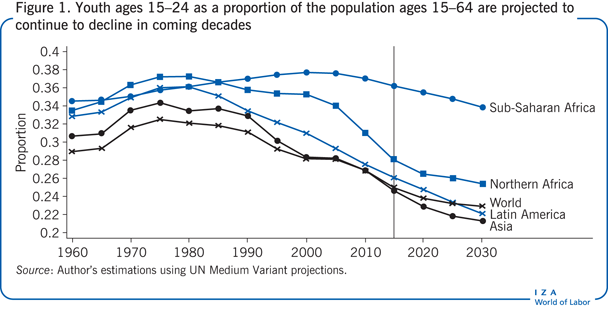
But youth ratios are expected to continue to decline in coming decades. And for all developing regions except sub-Saharan Africa, the ratios peaked around 1975–1980 at levels of more than 34%. Sub-Saharan Africa’s current high youth ratio—34% in 2015—looks somewhat less daunting when viewed in the context of Asia and Latin America’s youth ratios of more than 34% in 1975.
Regions that experienced a rapid fertility decline, such as Asia and Latin America, experienced a corresponding rapid decline in their youth ratio. These declines are projected to continue in coming decades as large cohorts born in the 1970s and 1980s pass through the age structure. In Northern Africa, where the youth bulge is often mentioned as a factor in the Arab Spring, youth are a much smaller proportion of the working-age population today than they were in the 1970s.
A key lesson from the Illustration and Figure 1 is that there is little evidence that most developing regions are experiencing a major youth bulge. Youth are a smaller proportion of the working-age population than they were in the 1980s in Asia, Latin America, and North Africa. Sub-Saharan Africa is an exception.
Are youth bulges related to youth unemployment?
Given the wide range of youth ratios, it is natural to consider whether countries with higher youth ratios have higher rates of youth unemployment.
Comparing the youth ratio and youth unemployment
One simple way of looking at this question is to plot youth unemployment rates against the share of youth in the working-age population (Figure 2). The scatterplot shows no strong tendency for higher youth ratios to be associated with higher youth unemployment. The scatterplot implies that youth unemployment is lower when youth are a higher share of the working-age population (the best-fit regression line for developing countries has a negative slope). More developed countries have a much lower youth ratio than less developed countries, but they do not have lower youth unemployment on average.
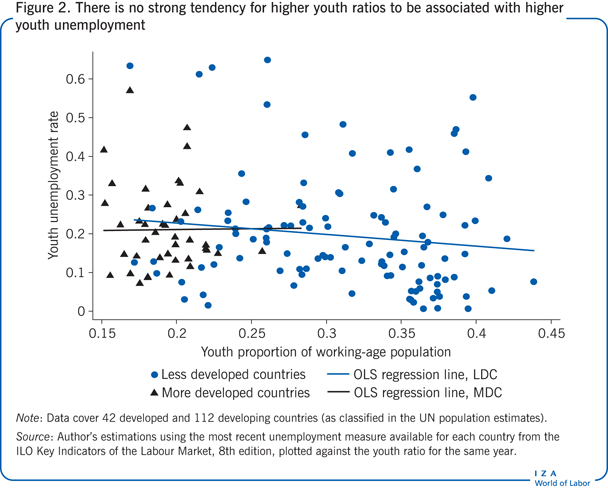
Figure 2 shows that any given youth ratio is associated with a wide range of youth unemployment rates. Of the many countries with youth ratios around 36%, for example, estimated youth unemployment ranges from under 5% in Madagascar and Niger to 55% in Namibia. Japan and Spain have among the lowest youth ratios in the world, around 15%, but they have very different youth unemployment rates—10% in Japan and 43% in Spain. There are many reasons to be concerned about the accuracy of these unemployment rates, especially the very low rates estimated for many African countries. These are arguably the best estimates available, however, and should give at least a broad picture of the relationship between youth ratios and youth unemployment.
In addition to uncertainty about the data, there are other reasons not to make too much of the pattern shown in Figure 2. Many factors affect youth unemployment, and a simple cross-sectional relationship may be misleading.
Comparing changes in the youth ratio and in youth unemployment
A better way to look at the issue is to analyze whether increases in the youth ratio in a given country are associated with increases or decreases in youth unemployment. The difference between the average 2000–2009 youth unemployment rate and the average 1990–1999 youth unemployment rate plotted against the difference between the average 2000–2009 youth ratio and the average 1990–1999 youth ratio shows a slight positive relationship between the change in the youth ratio and the change in youth unemployment (Figure 3). Countries that had larger increases in the youth ratio had larger increases in unemployment (a positive slope for the best-fit regression line for both more developed and less developed countries, although the slope for developing countries is close to zero and is not statistically significant).
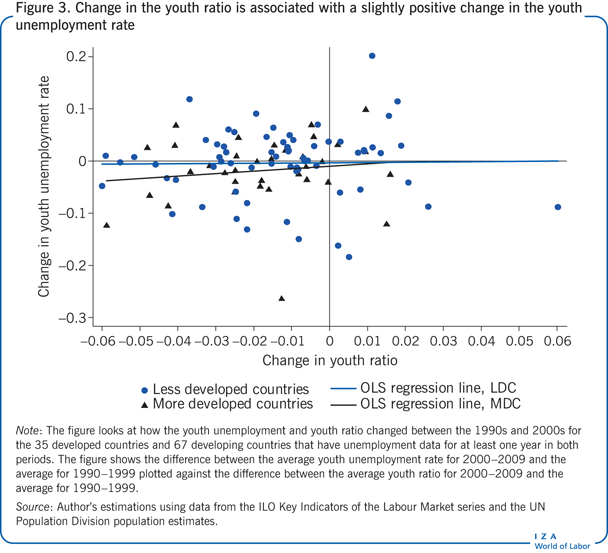
In most countries (80 of the 102 in the sample), the youth share of the working-age population fell between the 1990s and the 2000s, as fertility rates declined rapidly in developing countries and populations aged in high-income countries (where fertility rates had already dropped earlier). Slightly more than half the countries that experienced declining youth ratios experienced an increase in youth unemployment. But there is only a weak relationship between changes in youth ratios and changes in youth unemployment (see Figure 3).
Comparing youth ratios and youth unemployment while controlling for other factors
The statistical analysis can be pushed further by using regression analysis to look at the relationship between youth ratios and youth unemployment while controlling for other important factors such as the growth rate of the economy and the overall level of unemployment. For example, the analysis might look at whether the fact that the decline in youth ratios in recent years coincided with a global recession, weakened what might otherwise have been a larger decline in youth unemployment in response to the falling youth ratio.
The ILO data have multiple observations for most countries. Excluding developed countries, the coverage averages eight years, with 81% of countries having at least two years of data. A standard econometric approach looks only at the deviations from each country’s overall mean in both the youth unemployment rate and the youth ratio or the youth growth rate (this is called a fixed effect regression). Other variables can also be included, such as the country’s growth rate of GDP in a given year, taken from the Heston and Summers Penn World Tables (). One logical specification is to include both year fixed effects and country fixed effects, looking at deviations in a given year from the overall unemployment level in that year (taking account, for example, of a global recession or expansion) and at deviations from a country’s overall average unemployment rate (taking account of the fact that some countries have persistently higher or lower unemployment rates). Note that issues such as labor market institutions and the degree of informality are “swept away” by the fixed effects regression, to the extent that these factors are constant in a country over time. The estimates look only at changes in youth ratios and youth unemployment within a given country over time.
Applying this approach to the full set of ILO youth unemployment data (154 countries with 1,805 country-years of observations) shows a much stronger relationship between the youth ratio and youth unemployment than is suggested by Figure 3. Following [7] and regressing the logarithm of the youth unemployment rate on the logarithm of the youth ratio estimates an elasticity of 0.62 (the elasticity is statistically significantly different from zero at the 1% level). This elasticity implies that a 10% increase in the youth ratio leads to a 6% increase in youth unemployment. Controlling for GDP growth yields a higher elasticity of 0.71, implying that a 10% increase in the youth ratio leads to a 7% increase in youth unemployment. This is a strong relationship, stronger than that identified in previous research.
What does it mean that the elasticity of youth unemployment to the youth ratio is 0.7? To illustrate, consider that Tanzania will have a youth ratio that is 2.6 times that of Spain in 2015 (37% compared with 14%). With an elasticity of 0.7, this implies that Tanzania would have a youth unemployment rate 1.8 times that of Spain in 2015, assuming that only the youth ratio differed between the two countries. In fact, however, Spain’s youth unemployment rate (17.0%) was almost twice as high as Tanzania’s (8.8%) in 2006, the most recent year with data, the opposite of what youth ratios alone would predict. Obviously, many other factors affect youth unemployment (as is clear in Figure 2). But the regression estimates suggest that the size of the youth population may be important, even though its effects are often obscured by other factors.
In regression estimates for high-income countries only (42 countries with 887 country-year observations), the elasticity is even higher, around 1.0, implying that a 10% increase in the youth ratio leads to a 10% increase in youth unemployment. In regression estimates for low- and middle-income countries only (112 countries with 918 country-year observations), the elasticity drops to 0.3, and the estimates are not statistically significant. These regression analyses do not find strong evidence that youth ratios have been the main driver of youth unemployment in developing countries. The ILO data provide far from complete coverage of countries or years for developing countries, but with 918 country-year observations the coverage should be good enough to estimate the relationship between youth ratios and youth unemployment, especially given the large changes in youth ratios in recent decades in developing countries.
Limitations and gaps
One reason there are few studies of the relationship between youth demography and youth unemployment is the limited data on youth unemployment, especially in developing countries. Of the 112 developing countries that have unemployment data in the ILO database, 46% have three or fewer observations for 1980–2010. Of 1,705 possible country-years of data on African unemployment for 1980–2010 (55 countries times 31 years), there are only 104 country-years of data in the ILO database. Thus caution is required in interpreting any analysis of the determinants of youth unemployment, especially in developing countries.
Another concern is that standard unemployment measures may not capture the problems faced by young people in developing countries, where underemployment and low productivity are important. Population is easier to estimate than unemployment. A single census provides fairly accurate estimates of the age distribution for many years. So analyses of trends in the demography of youth populations are likely to be more reliable than analyses of how demography affects the labor market.
As in the previous literature, many issues have been left out of this analysis. Women’s rising labor force participation rates, for example, might affect youth unemployment. Women’s participation might in turn respond to youth demography, so a careful analysis of these links is challenging. The analysis also does not take into account differences in labor market institutions across countries or the very different meaning of unemployment in high-income urbanized countries and rural agrarian countries. As noted, the fixed effects estimates make these issues less important, since they are based on changes within countries rather than differences across countries. Even if there are changes in labor market institutions and the degree of informality within countries over time, these affect the results only to the extent that they are correlated with fluctuations in age structure.
Further research needs to explore why there appears to be a stronger impact of youth demography on youth unemployment in high-income countries than in developing countries. One possibility is that data on youth unemployment are less accurate in developing countries. Another is that the relative size of the youth population is less important in countries in which much of the population still engages in subsistence farming.
Summary and policy advice
While it may seem obvious that a higher proportion of young people in the working-age population (a youth bulge) would lead to higher youth unemployment, the evidence of such a relationship is limited, especially for developing countries (see Figure 2). Developed countries have much lower youth ratios than most developing countries, but they have higher levels of youth unemployment. Youth ratios have declined in recent decades in most countries at all income levels, but youth unemployment has not. While many factors affect youth unemployment, and making simple comparisons across countries and time is inadequate for fully understanding the impact of youth demographics on the labor market, it is noteworthy that these simple comparisons do not associate high shares of young people in the working-age population with high youth unemployment rates.
More careful econometric analysis suggests, however, that high youth ratios might lead to higher youth unemployment in some cases. Once GDP growth is controlled for and differences in overall unemployment across years and countries are removed (by including both year and country fixed effects), regressions estimate an elasticity of 0.7, meaning that a 10% increase in the youth ratio leads to a 7% increase in youth unemployment. This is higher than elasticities found in the previous literature, though the results are driven mainly by developed countries. In developing countries, the elasticity is 0.3 and is not statistically significant. One possible explanation for this divergence is that data on youth unemployment are less accurate in developing countries. Another possibility is that the relative size of the youth population is less important in countries in which much of the population still engages in subsistence farming.
While the evidence on the link between youth demography and the labor market is somewhat mixed, there is less uncertainty about trends in the proportion of young people in the working-age population. Youth ratios have been falling in most countries for several decades (see the Illustration and Figure 1). In high-income countries, the ratio has fallen as part of a general trend toward population aging. The youth ratio has fallen rapidly in the many developing countries that have experienced large fertility declines and will continue to fall for several more decades. This may reduce pressure on the youth labor market and help reduce youth unemployment. These demographic effects may be offset by many other factors affecting youth unemployment, however, as has been the case in recent decades.
The important exception to the trend toward rapid declines in the relative size of the youth labor force is sub-Saharan Africa. Fertility has fallen much more slowly there, with the result that age structures continue to be very young. In most countries, these high youth ratios have not resulted in high youth unemployment, at least as measured in conventional labor market surveys. The continuing rapid growth of youth cohorts will surely be a challenge, however, as African countries attempt to improve economic outcomes for young people.
The most recent data on youth unemployment and the youth share of the working-age population across countries show very little relationship. In most countries, declining youth ratios in recent decades have not translated into lower youth unemployment. Thus policymakers should not expect that declining relative (and absolute) youth cohorts can take the place of programs and policies that will more directly improve youth labor markets, such as improvements in education and greater labor market flexibility.
Acknowledgments
The author thanks an anonymous referee and the IZA World of Labor editors for many helpful suggestions on earlier drafts.
Competing interests
The IZA World of Labor project is committed to the IZA Guiding Principles of Research Integrity. The author declares to have observed these principles.
© David Lam