
Elevator pitch
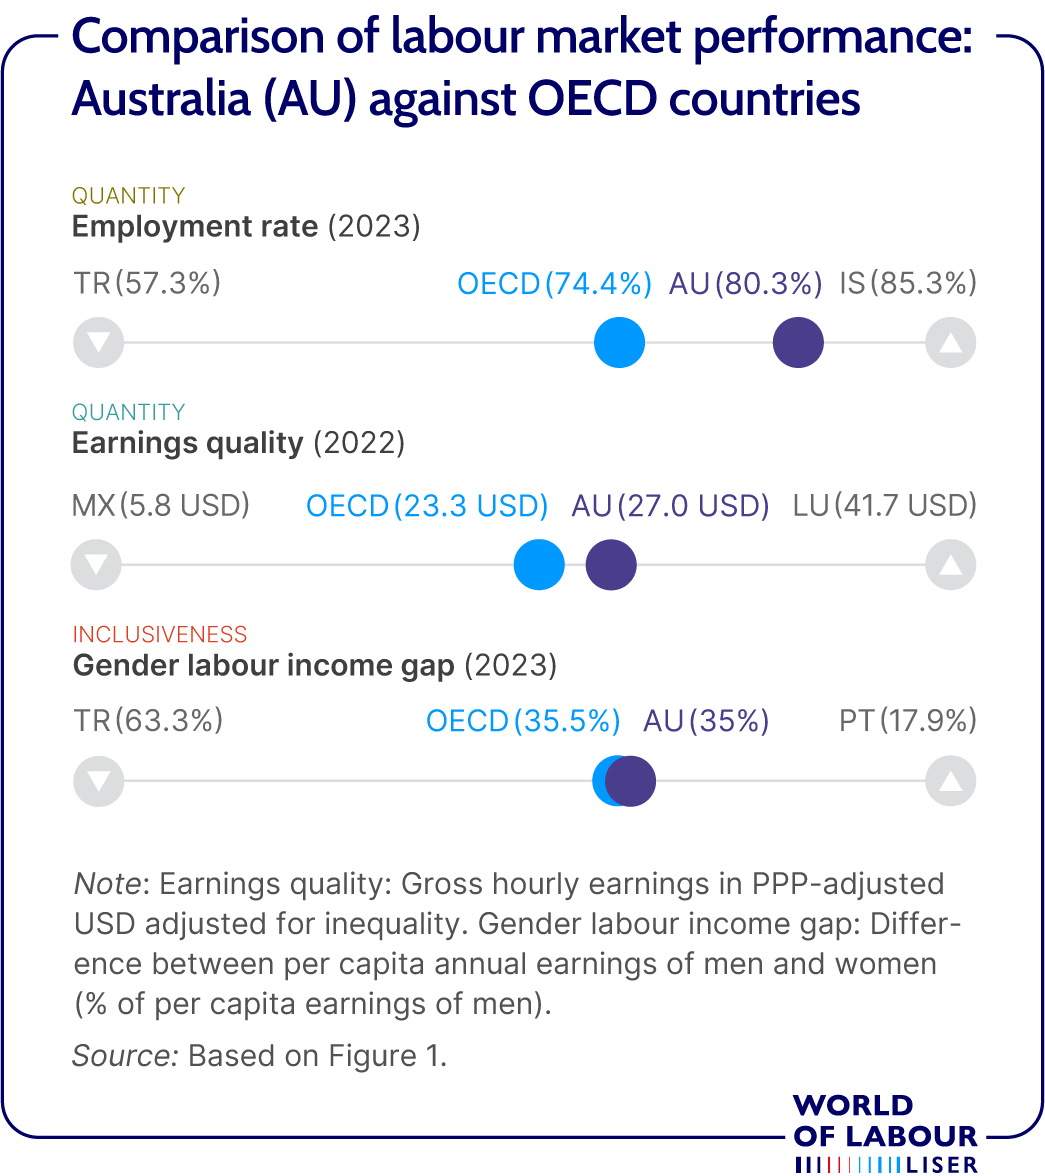
Since 1991 the Australian economy has experienced sustained growth. Aided by the commodities boom and strong public finances, the Australian economy negotiated the global financial crisis without falling into recession. However, the dislocation associated with the Covid-19 pandemic saw the economy enter recession in 2020, before sharply rebounding. Since 2022, unemployment and real weekly earnings have returned to pre-Covid-19 levels but more recently real wages have slipped due to high inflation. Further recent headwinds include a rise in long-term unemployment, deteriorating youth labour market, and a stagnant gender earnings gap.
Key findings
Strengths
Australia experienced three decades of sustained economic growth from 1990, leading to strong growth in employment and lower unemployment rates.
The economic dislocation associated with the Covid-19 pandemic resulted in a brief recession in 2020, followed by a quick rebound; unemployment fell to multi-decade lows in 2022–23 before easing slightly.
Labour force participation of men and women aged 55–64 years has increased and grew most rapidly for those aged 65 and over.
Real average earnings of full-time workers have increased.
Following rising income inequality from the late 1970s to 1990, inequality has remained relatively stable since 2000.
Weaknesses
Despite sustained economic growth, long-term unemployment has increased over the past decade, returning to the relatively high levels of the early 2000s.
Gains in earnings through the 2000s–2010s were partly reversed post-Covid, with a record real wage fall in 2022 and only partial recovery more recently.
Teenage workers face limited labour market opportunities.
There has been remarkably little improvement in the gender earnings differential since 2000.
Author's main message
The Australian labour market performed strongly through 2000–2019, aided by the commodities boom: unemployment fell, participation rose, and real average earnings increased. The Covid-19 pandemic brought a brief recession in 2020; however, the labour market quickly rebounded, with unemployment falling to multi-decade lows in 2022 before easing, while high inflation drove a post-Covid-19 squeeze in real wages. Despite the generally positive outlook, rising long-term unemployment, limited youth labour market prospects, excessive income growth among the top earners, and stagnating gender earnings differentials are causes for concern. Policymakers could attempt to address these issues through taxation and transfer policies to moderate growth at the very top of the income distribution while promoting it toward the bottom of the income distribution.
Motivation
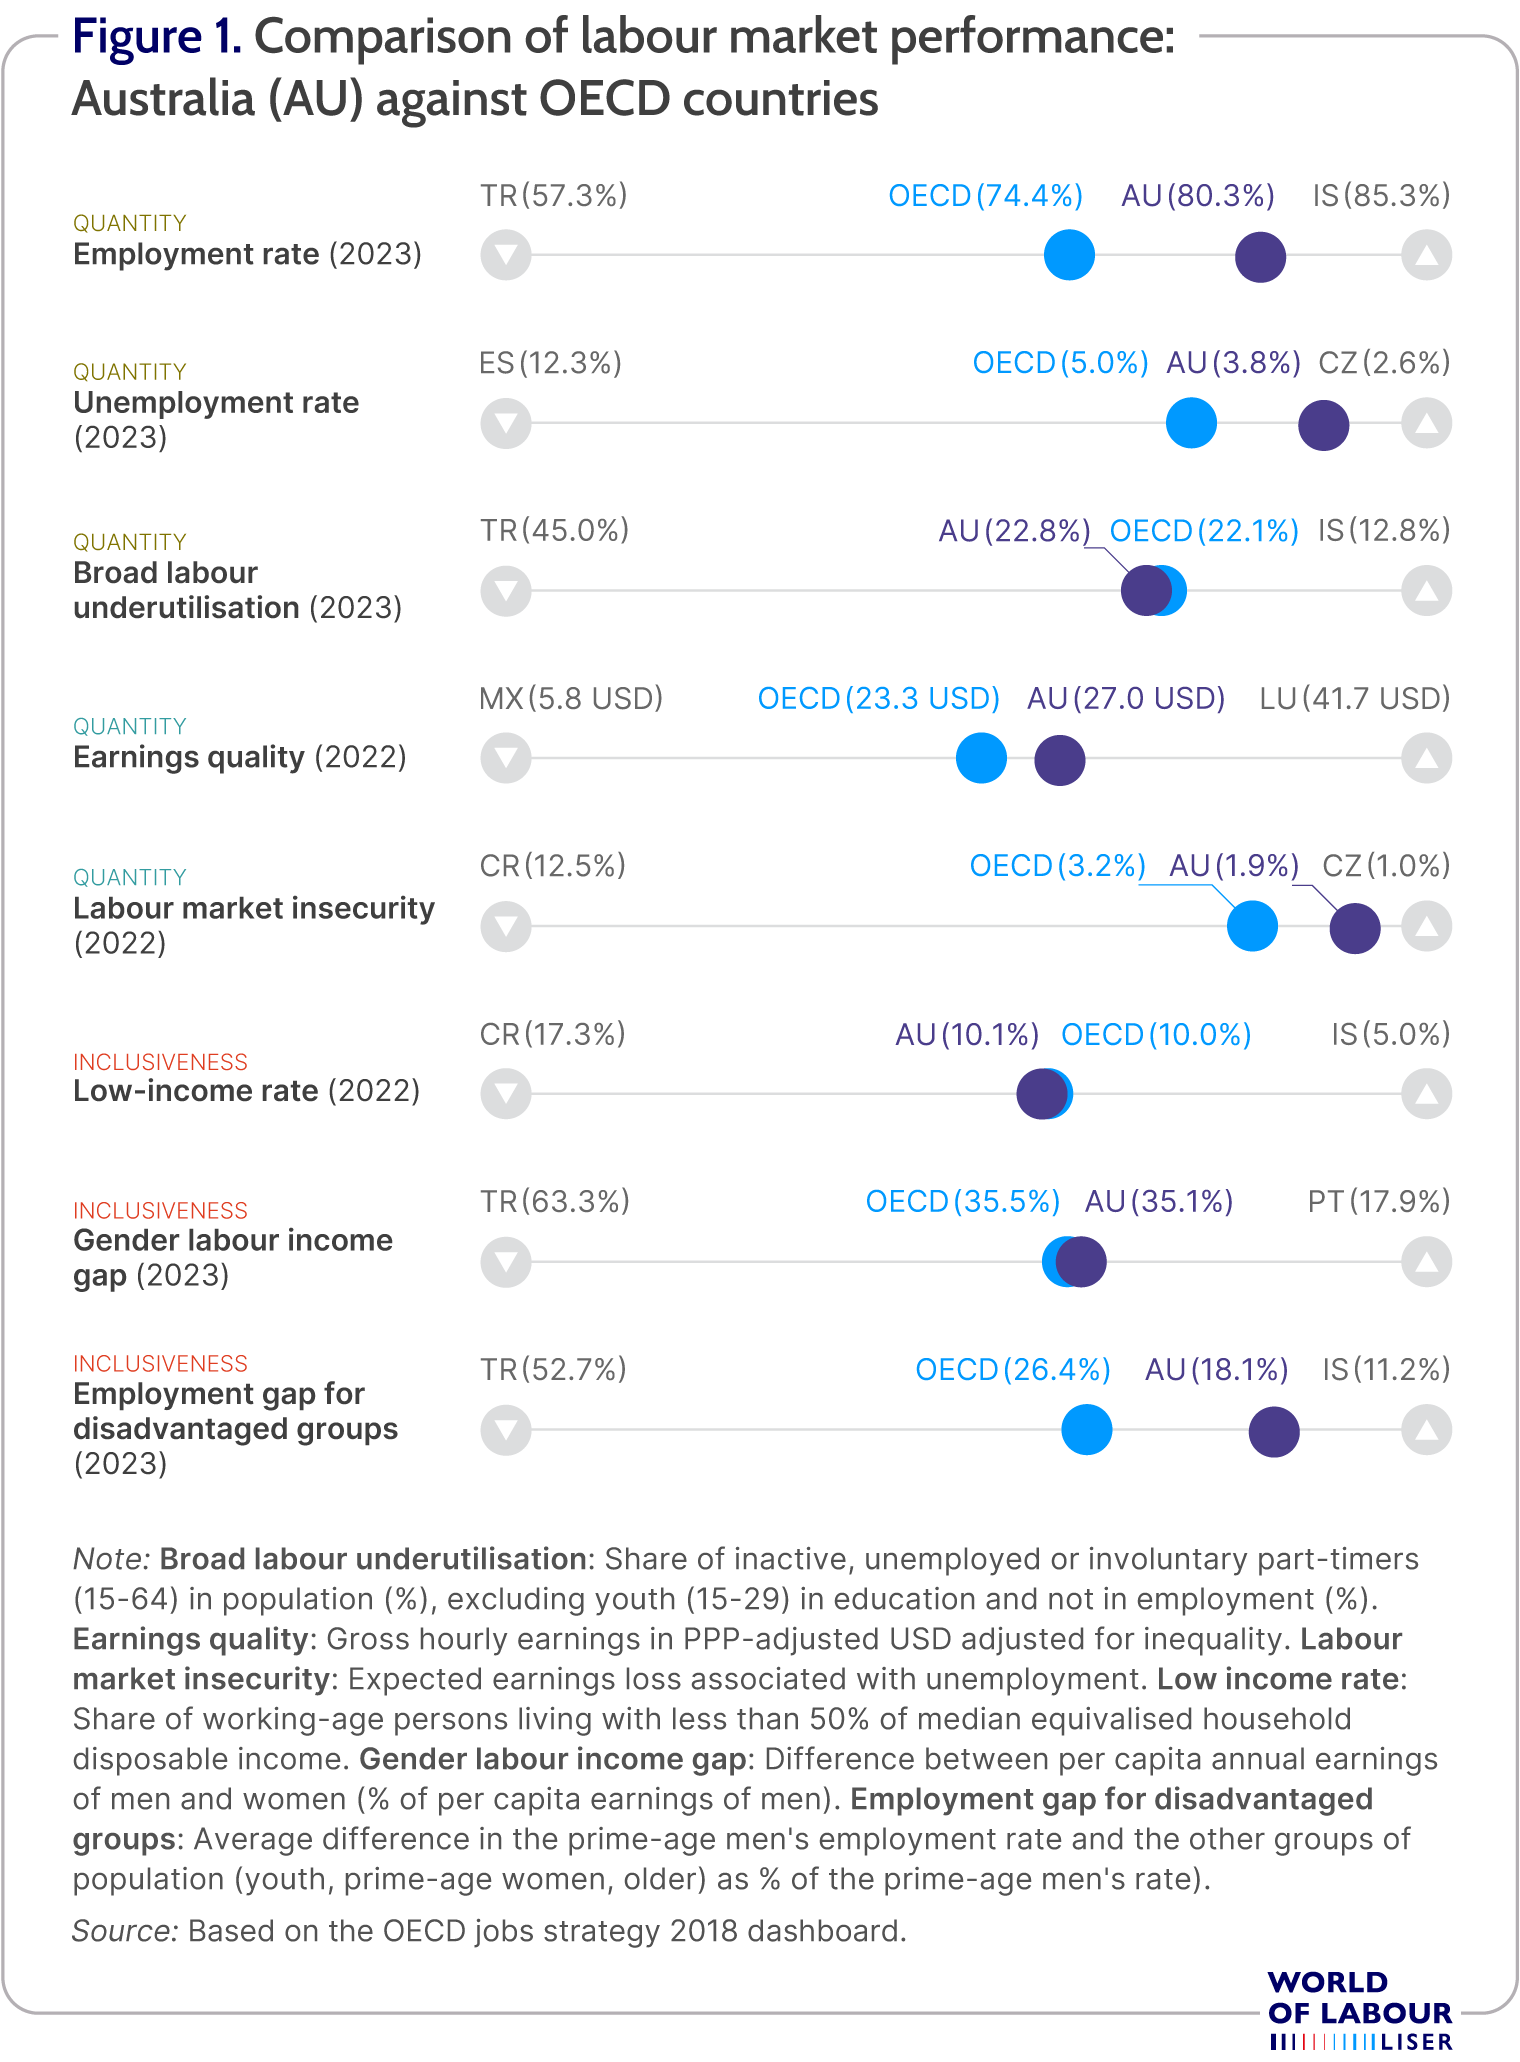
Reliable and timely information on labour market developments is critical for understanding developing trends and highlighting emerging problems that require appropriate policy responses. Considering the performance of national labour markets in an international context can help identify the institutions, policies, and circumstances that account for the experiences of a specific country. Therefore, it is important to understand the key features of the performance of the Australian labour market.
Discussion of strengths and weaknesses
Aggregate issues
Australia enjoyed almost 30 years of uninterrupted growth from Q3 1991 until the Covid-19 shock in early 2020, having weathered the Asian financial crisis, the 2001 tech downturn and the 2008–09 global financial crisis without experiencing a recession. Over the long run, average annual growth has been around 3.1%, with notable resilience despite successive global shocks. That streak ended with a brief, pandemic-induced recession in 2020–where GDP fell 7.0% in the June quarter 2020, after which growth rebounded strongly through 2021–23 before moderating amid higher inflation and interest rates.
Against the background of sustained output growth, cyclical factors were evident in the labour market. Figure 2 charts the (seasonally adjusted) aggregate unemployment rate series from 2000 to 2024. Pre-Covid-19, the unemployment rate peaked in 2001 at 6.8%. Sustained economic growth led to a progressive decline in unemployment to 4.3% of the labour force in 2008, with the economy being close to full employment. Despite technically avoiding a recession (defined as two consecutive quarters of negative real GDP growth) following the onset of the global financial crisis, there was a marked increase in the unemployment rate to 5.7% in 2009, which then stabilised around 5.2% from 2010 to 2013. This was followed by a further weakening of the labour market, coinciding with the end of the commodities boom and reduced mining investment, which saw the unemployment rate increase to 6.2% in 2014–2015. Although the unemployment rate was lower on average over the 2000–2019 period than the preceding three decades, the pattern of a sharp rise followed by a prolonged period of higher unemployment exemplified Australia’s postwar experience.
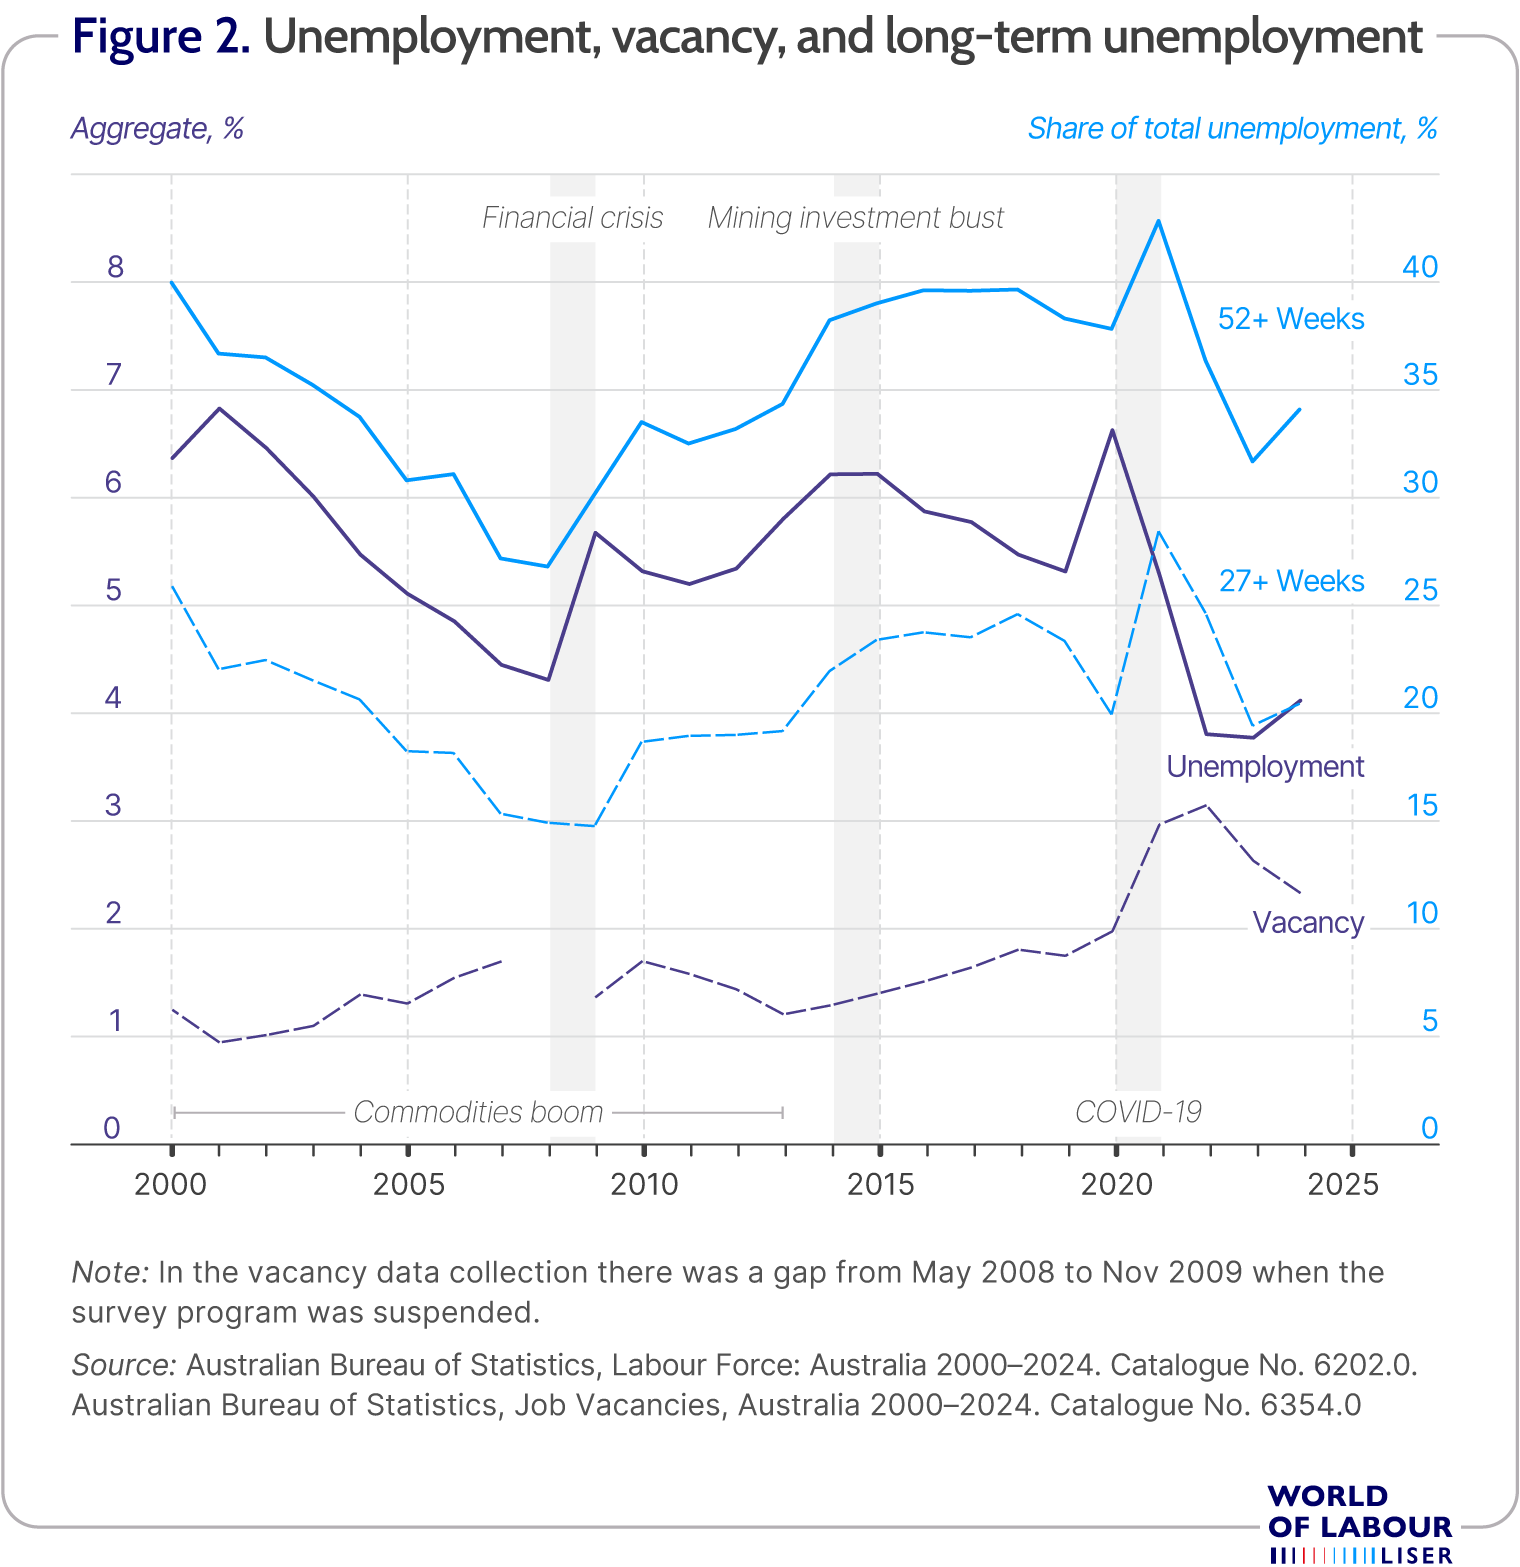 During the pandemic, unemployment rose sharply to around 7% in mid-2020, then fell rapidly to multi-decade lows of about 3.8% in 2022–23 as the economy reopened. Through 2023–24 the unemployment rate edged higher, and vacancies eased from record peaks, indicating a gradual cooling from exceptionally tight conditions. Long-term unemployment increased during the initial shock but declined as hiring strengthened in the recovery.
Since the early 1990s, the Australian Bureau of Statistics (ABS) has collected information on job vacancies through a quarterly survey of Australian businesses. There was a gap in collection from May 2008 to November 2009 when the survey programme was suspended. Figure 2 charts the aggregate job vacancy rate, which is the number of recorded vacancies expressed as a percentage of vacancies plus employees, across all industries in November of each year the survey was conducted. The vacancy rate is a crude measure of unmet labour demand and as such is a useful counter-cyclical indicator. Over the period 2000–2019, the vacancy rate broadly mirrored the unemployment series: a brief dip in 2001, a rise from 2002 to the 2008 break, another rise from 2009 to 2010, a fall through 2013, and a renewed increase to 2019, before easing slightly pre-Covid-19.
Covid-19 and after
The vacancy rate fell sharply in early 2020 with the initial shock, then rose to record highs in 2021–22 as the economy reopened and labour demand outpaced supply. Through 2023–24 it eased from those peaks yet remained above the 2010s average, consistent with a cooling from exceptionally tight conditions while remaining strong by historical standards.
Underlying the relatively low level of aggregate unemployment and dampened cyclical fluctuations are significant labour market disparities. Long-term unemployment is an enduring feature of the Australian labour market. From 2000 to 2008, the incidence of long-term unemployment, defined as being out of work and actively seeking it for 27 or more weeks, declined from 40% to just over one-quarter of the unemployed. The incidence of very-long-term unemployment, defined as being unemployed and actively seeking work for more than 52 weeks, fell over the same period from 26% to 15%. The weakening of the labour market in 2008 saw a reversal of this trend, with both long- and very-long-term unemployment rising over the past decade, eventually returning to the high levels of 2000–01. During Covid-19, the incidence rose sharply in 2020, then declined through 2022–23 as hiring strengthened. By 2024 it had eased from its pandemic peak but had not returned to the mid-2000s lows. The high and persistent incidence of long-term unemployment indicates that the burden of unemployment is increasingly concentrated among specific sections of Australian society.
Labour force participation—Aggregate, by gender and age
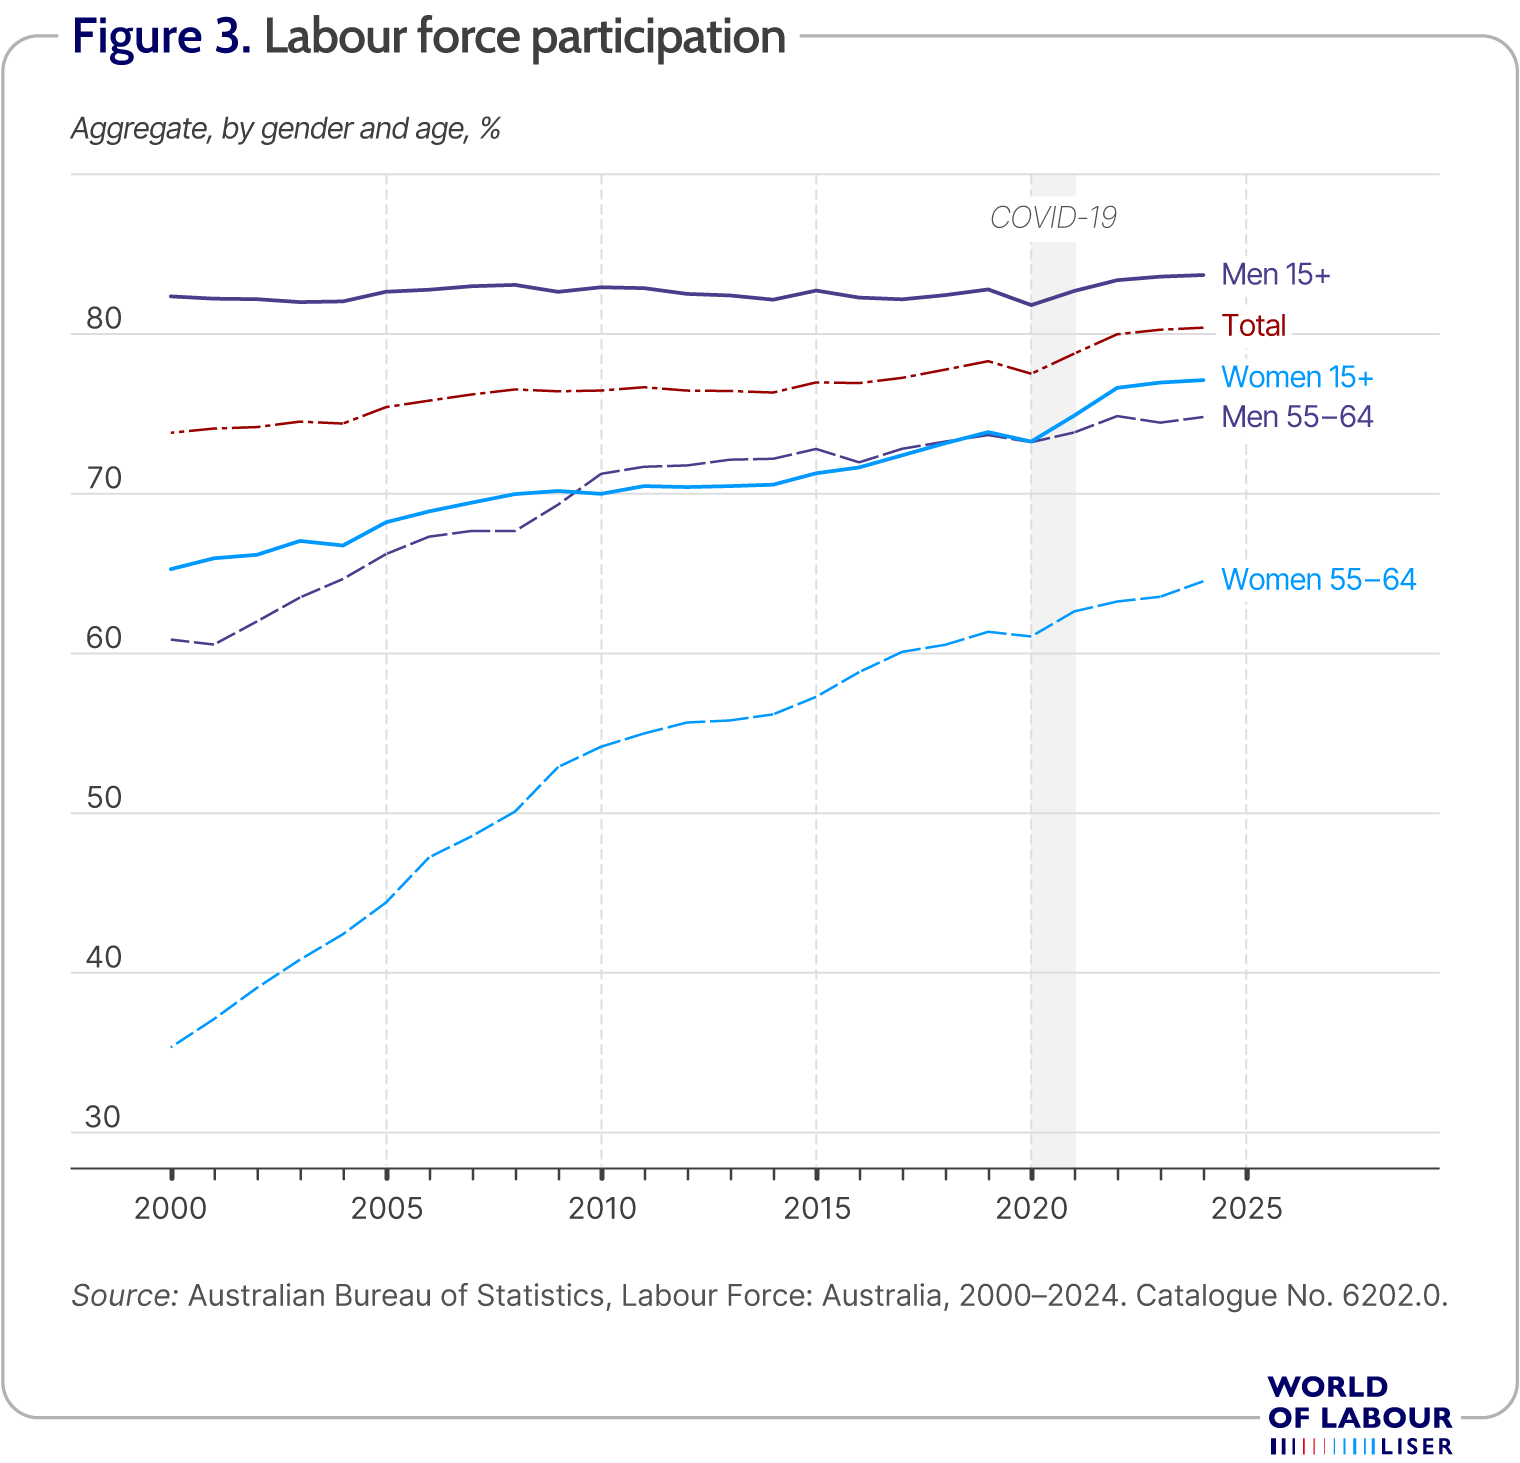
Figure 3 shows the total Australian labour force participation rate since 2000. Over this period, the fraction of the population aged 15–64 years either in employment or unemployed has grown from 73.8% to 80.4%. The growth in aggregate participation is due to increasing participation among women, which has risen from 65% to 77%, while participation among men has remained stable at around 82% until 2020 and grown to 84% in 2023 and 2024. The trends in participation rates are not uniform across age groups. The rise in participation rates is most pronounced among elderly individuals aged 55–64 years, which increased from 35% to 64.5% and 61% to 74.8% among women and men, respectively. In contrast, among young Australians aged 15–19, male participation declined from 59% to 56.9%, while female participation remained broadly stable at approximately 58%. Participation fell in 2020 with the onset of the pandemic, but the decline was short-lived, and the recovery was rapid. The drop was sharper for younger age groups, while participation among those aged 55–64 dipped only modestly and then rebounded to new highs by 2024.
 The demographics of unemployment—Age and sex
There are important differences in the incidence of unemployment across demographic groups in Australia. Like many countries, unemployment is especially high among teenagers. As shown in Figure 4, in the early 2000s unemployment among 15 to 19-year-olds was around 16.5%, compared to 6.5% for the total labour force. During the period of sustained growth up to 2008, unemployment declined across all groups, although the relative decline was less among the youngest. The slowdown in activity associated with the financial crisis led to an increase in unemployment among all demographic groups. However, this increase was most accentuated among teenagers, and since 2010 the teen-to-adult unemployment ratio has exceeded three. The pandemic caused a brief spike: in 2020 the ratio was 19.1% for those the 15–19-year-olds versus 6.6% for the total population, followed by a rapid fall to multi-decade lows: in 2022 the ratio was 11.4% for the 15–19-year-olds versus 3.8% for the total population. By 2024, unemployment had edged up (with almost 14% for 15–19-year-olds and only 4.1% for the total population), and the disadvantage experienced by 15–19-year-olds persisted. Combined with declining teen participation rates, there has been a clear deterioration in the labour market prospects of teenage workers over the past decade.
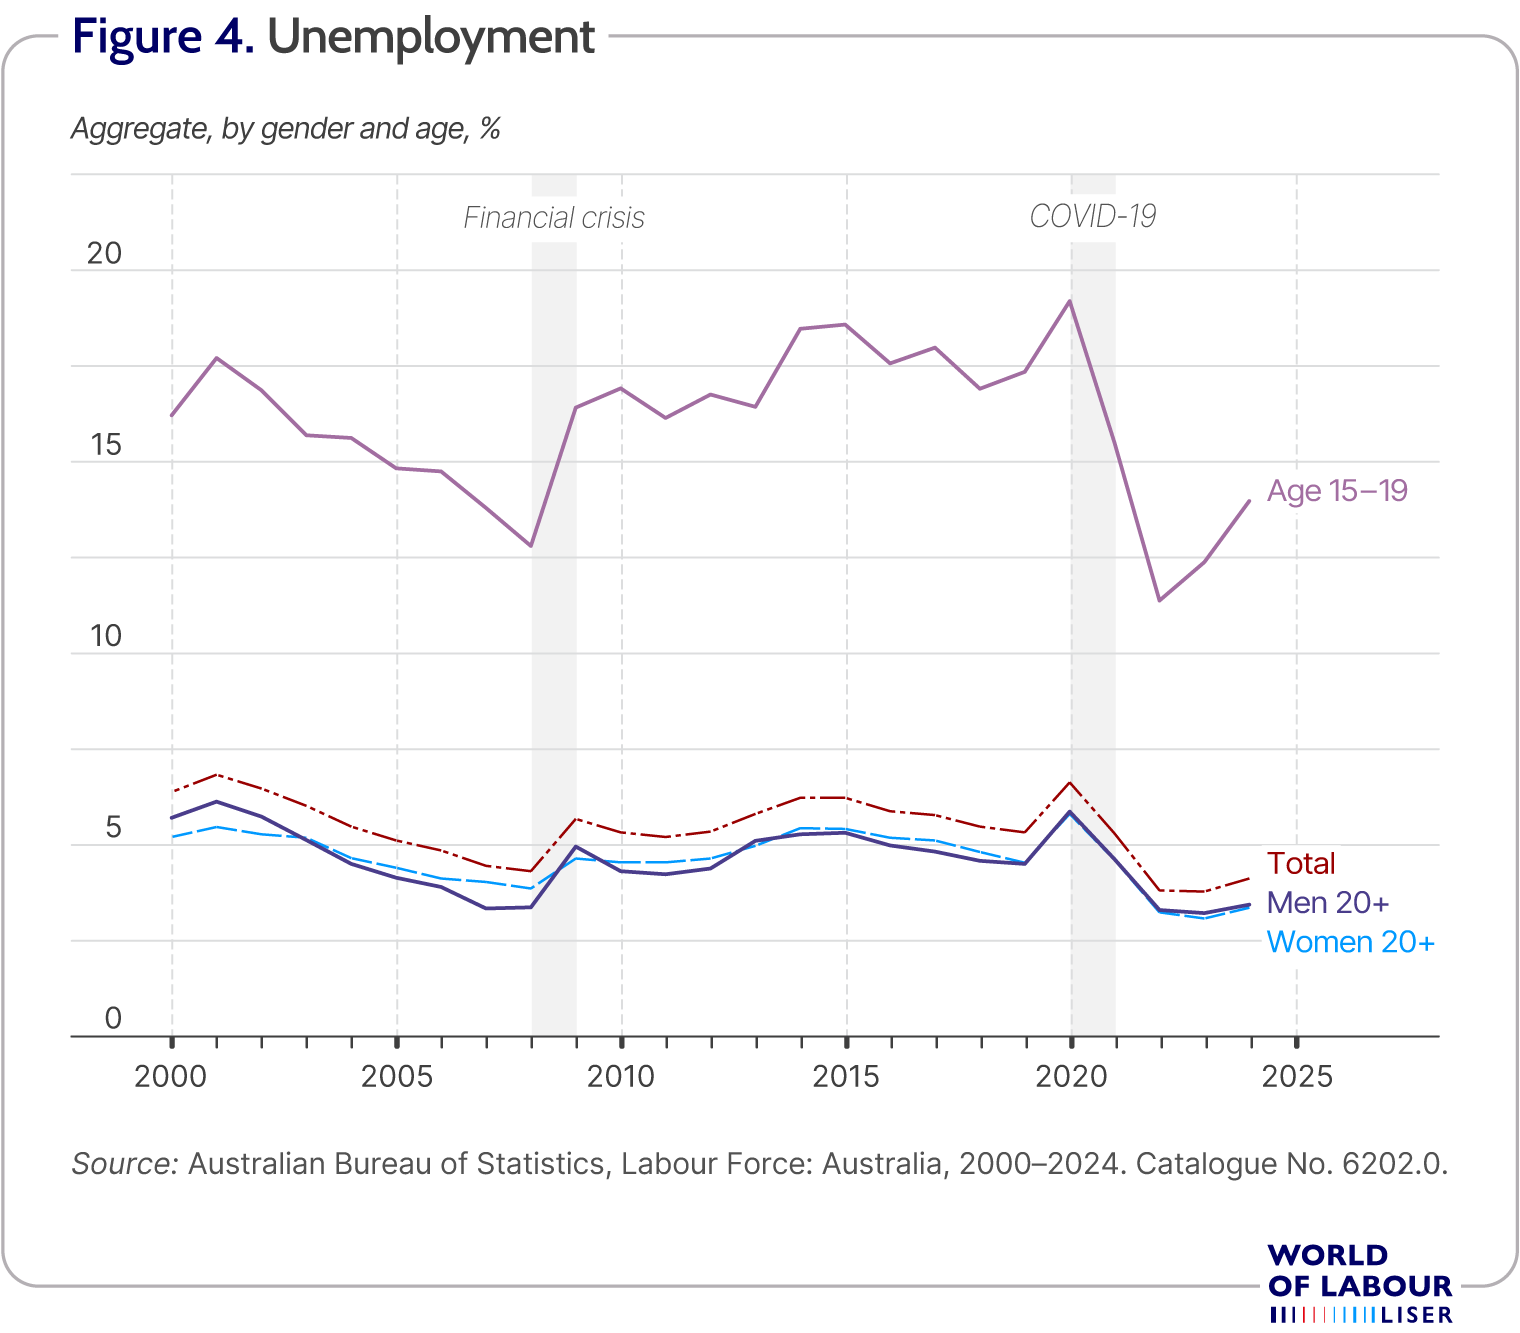 The path of adult male and female unemployment rates generally follows the aggregate series. Historically, male unemployment has fluctuated more over an economic cycle, as the cyclical sensitivity of female participation dampens variation in the female unemployment rate series (whereby a larger proportion of women leave the labour force during downturns, or enter it during booms, thus reducing the observed fluctuations in unemployment over a cycle). Typifying this pattern, the male unemployment rate declined more than the female rate during the period of strong economic activity leading up to the financial crisis in 2008. During the pandemic, male and female unemployment rates spiked in 2020, fell to multi-decade lows in 2022, and rose slightly in 2024 (approximately 3.4% and 3.4%, respectively). However, as observed in many countries, there has also been a secular rise in female participation rates and since 2010 the adult unemployment rates for both genders have tracked closely together.
Geographical differences
Aggregate labour market indicators can mask significant geographic variation. At the broadest scale, labour market conditions differ significantly across the states and territories of Australia, reflecting variations in industry and occupational structure, trade integration, exposure to economic shocks and differences in demographic composition and trends.
As illustrated by the employment-to-population ratios from the ABS Labour Force Survey in Figure 5, cross-state dispersion narrowed modestly during the long economic expansion prior to the Covid-19 pandemic. Across the six states, the gap between the highest- and lowest-employment-rate jurisdictions fell from 8.4 percentage points in 2001 to 7.2 percentage points in 2019. This convergence accelerated briefly during the pandemic before widening again to 8.3 percentage points by 2024. This fluctuating pattern is consistent with the view that national cycles interact with region-specific industrial composition and adjustment frictions to produce persistent spatial differences in labour utilisation [1].
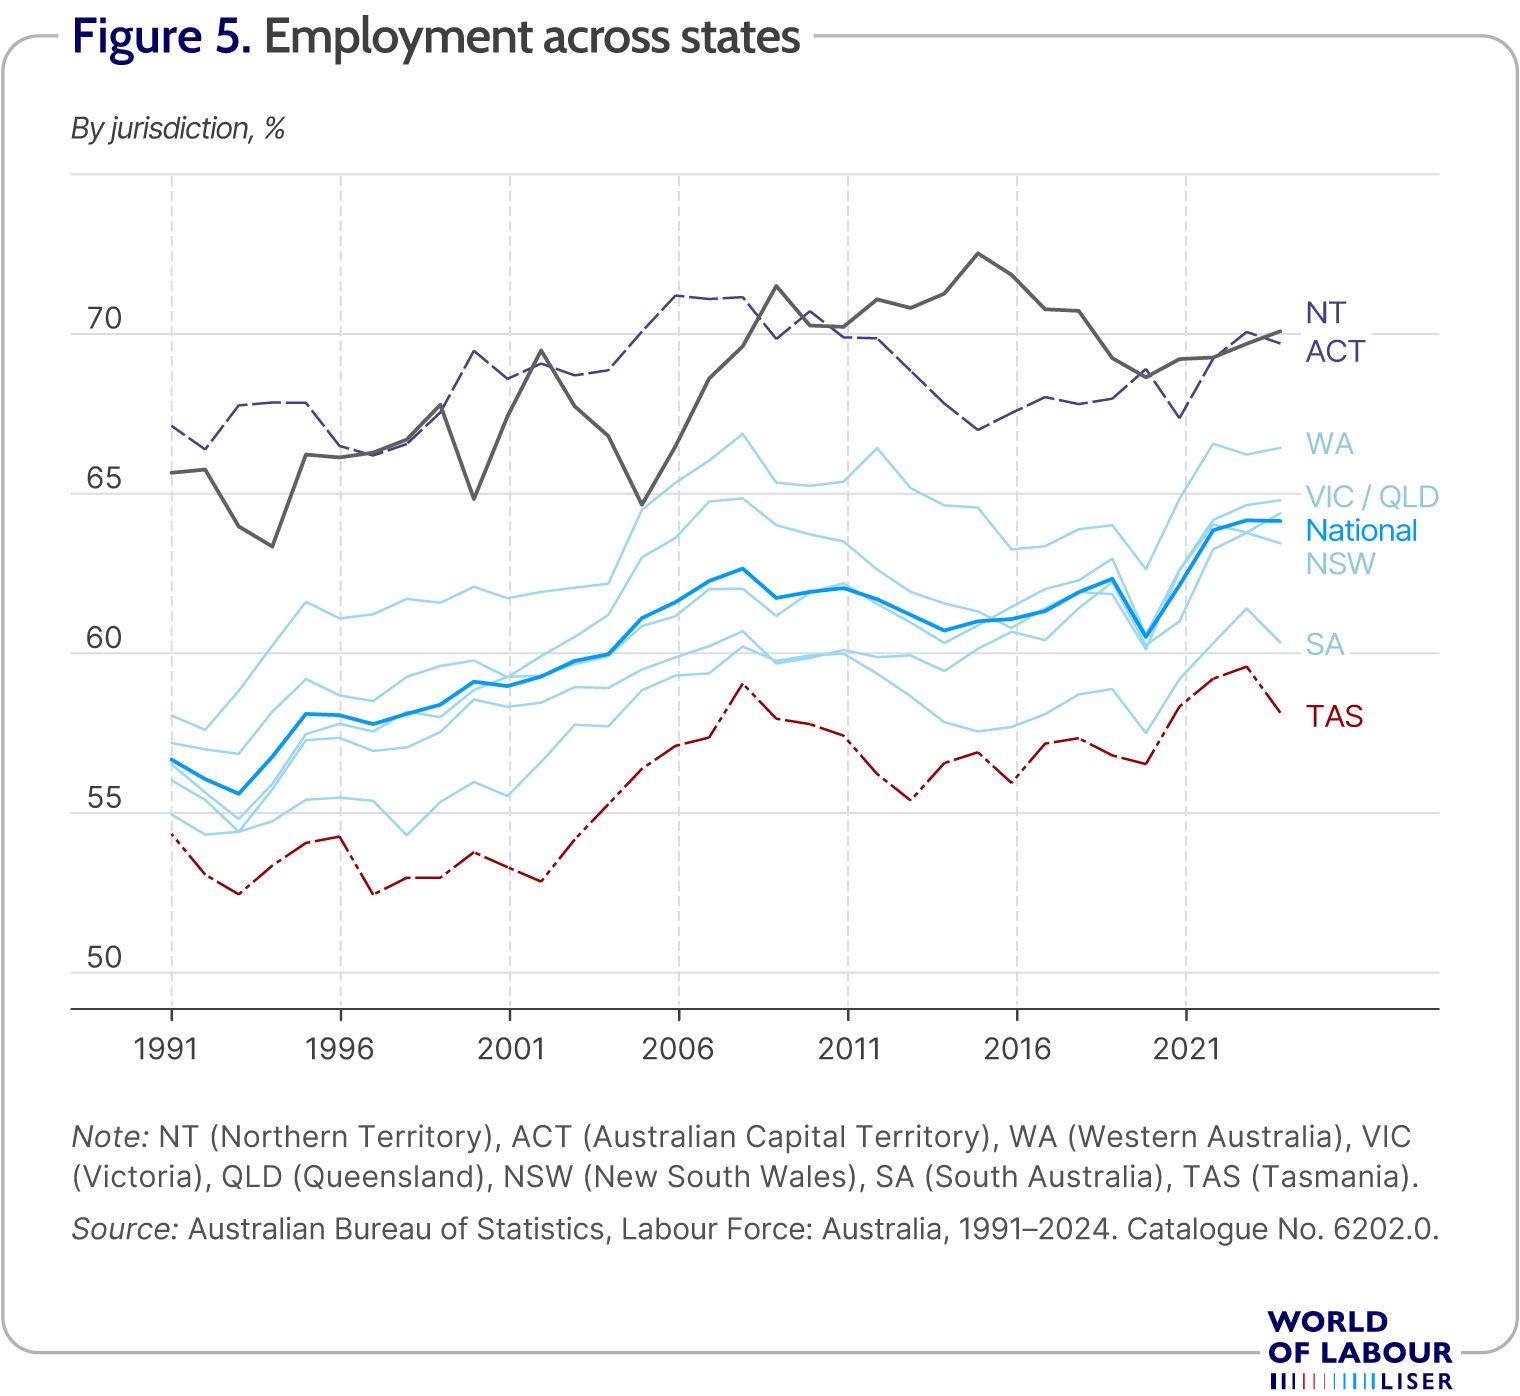 However, state-level averages remain a coarse unit for analysis. Each of the six Australian states are very large geographically, encompassing dense metropolitan labour markets and thinner regional and remote markets. Coupled with the unique economies of the two territories, the A.C.T. and N.T., the state-level aggregates obscure substantial within-state variation. Recent studies highlight that local labour markets often experience divergent trajectories during economic downturns. Regional areas more exposed to recessionary shocks can display elevated unemployment and lower participation for an extended period following the initial shock [1], [2], [3], [4].
Earnings developments
Aggregate statistics on average weekly earnings are derived from an ABS Survey of Employers, with the sample drawn from businesses registered with the Australian Tax Office. The series covers wage and salary earners and records their weekly compensation in the most recent pay period. The adjustment for inflation is made using the all-items Consumer Price Index (CPI).
Two series for real average weekly earnings are shown in Figure 6. The series are real weekly earnings and real weekly full-time ordinary earnings. Changes in the former may be due to variations in average real compensation, average hours worked per week, or both. Changes in average hours worked per week (for example, due to the changing incidence of full- and part-time employment) distorts this as a measure of hourly compensation when making comparisons across groups at a point in time, or for a specific group over time. A superior measure that more closely approximates hourly compensation is the series on real weekly full-time ordinary earnings. This series is based on full-time employees (35+ hours per week) and excludes overtime payments during the reference pay period. Although this concept does not completely remove work hours variation from the series, it substantially adjusts for differences in weekly labour usage.
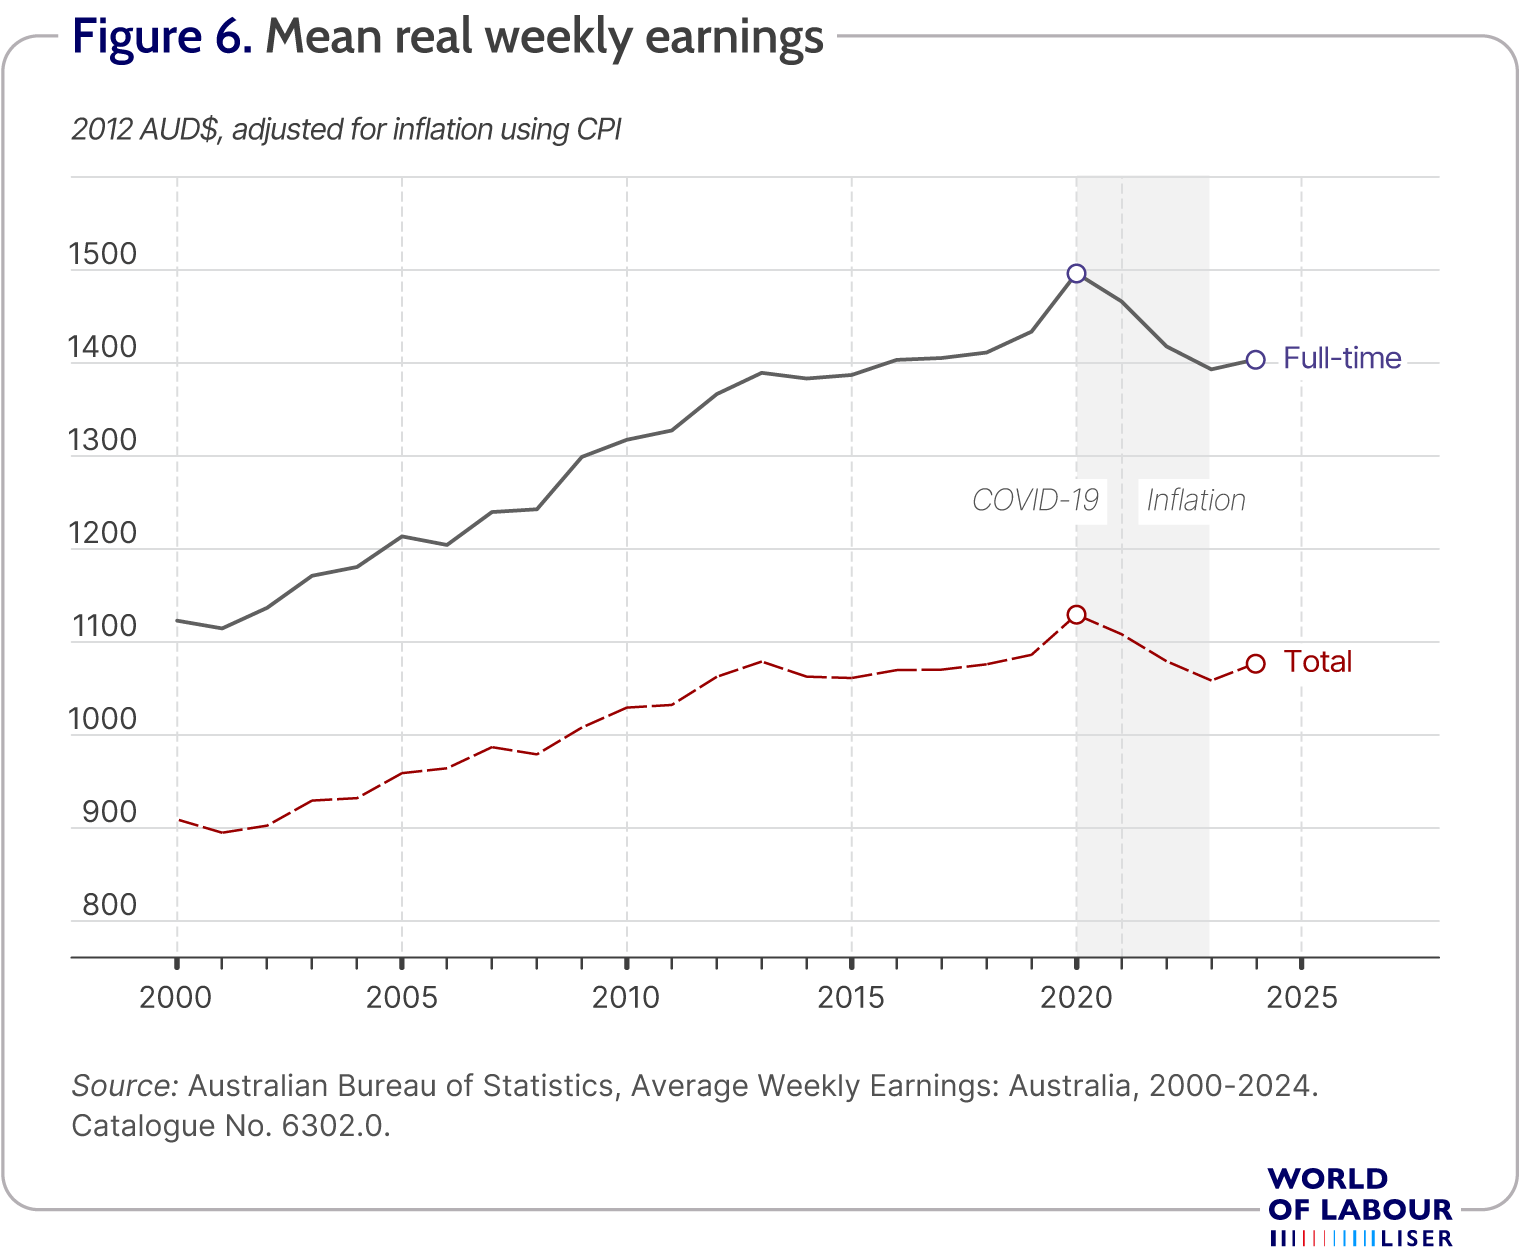 As evident from Figure 6, both series increased over time until the onset of the Covid-19 pandemic. The average annual growth rates were 1% and 1.4% for mean weekly and mean full-time ordinary earnings, respectively. The lower average rate for mean weekly earnings reflects the growing share of part-time work in total employment over this period. Although the average growth in mean full-time ordinary earnings is higher, given the sustained expansion of the aggregate economy over the past quarter of a century, the gains in mean earnings have been modest. Both series peaked in 2020, then fell through 2021–23 as inflation outpaced wage growth, with a modest uptick in 2024. The peak in real weekly earnings coincides with the rise in unemployment and the shift in the composition of employment toward higher paid-jobs, as low-wage workers exited the workforce during the lockdown. By 2024 they remained below their 2020 peaks, with the decline sharper for full-time ordinary earnings. The Treasury has also noted only moderate growth in real earnings, underscoring a subdued recovery [5].
Female–male earnings differences
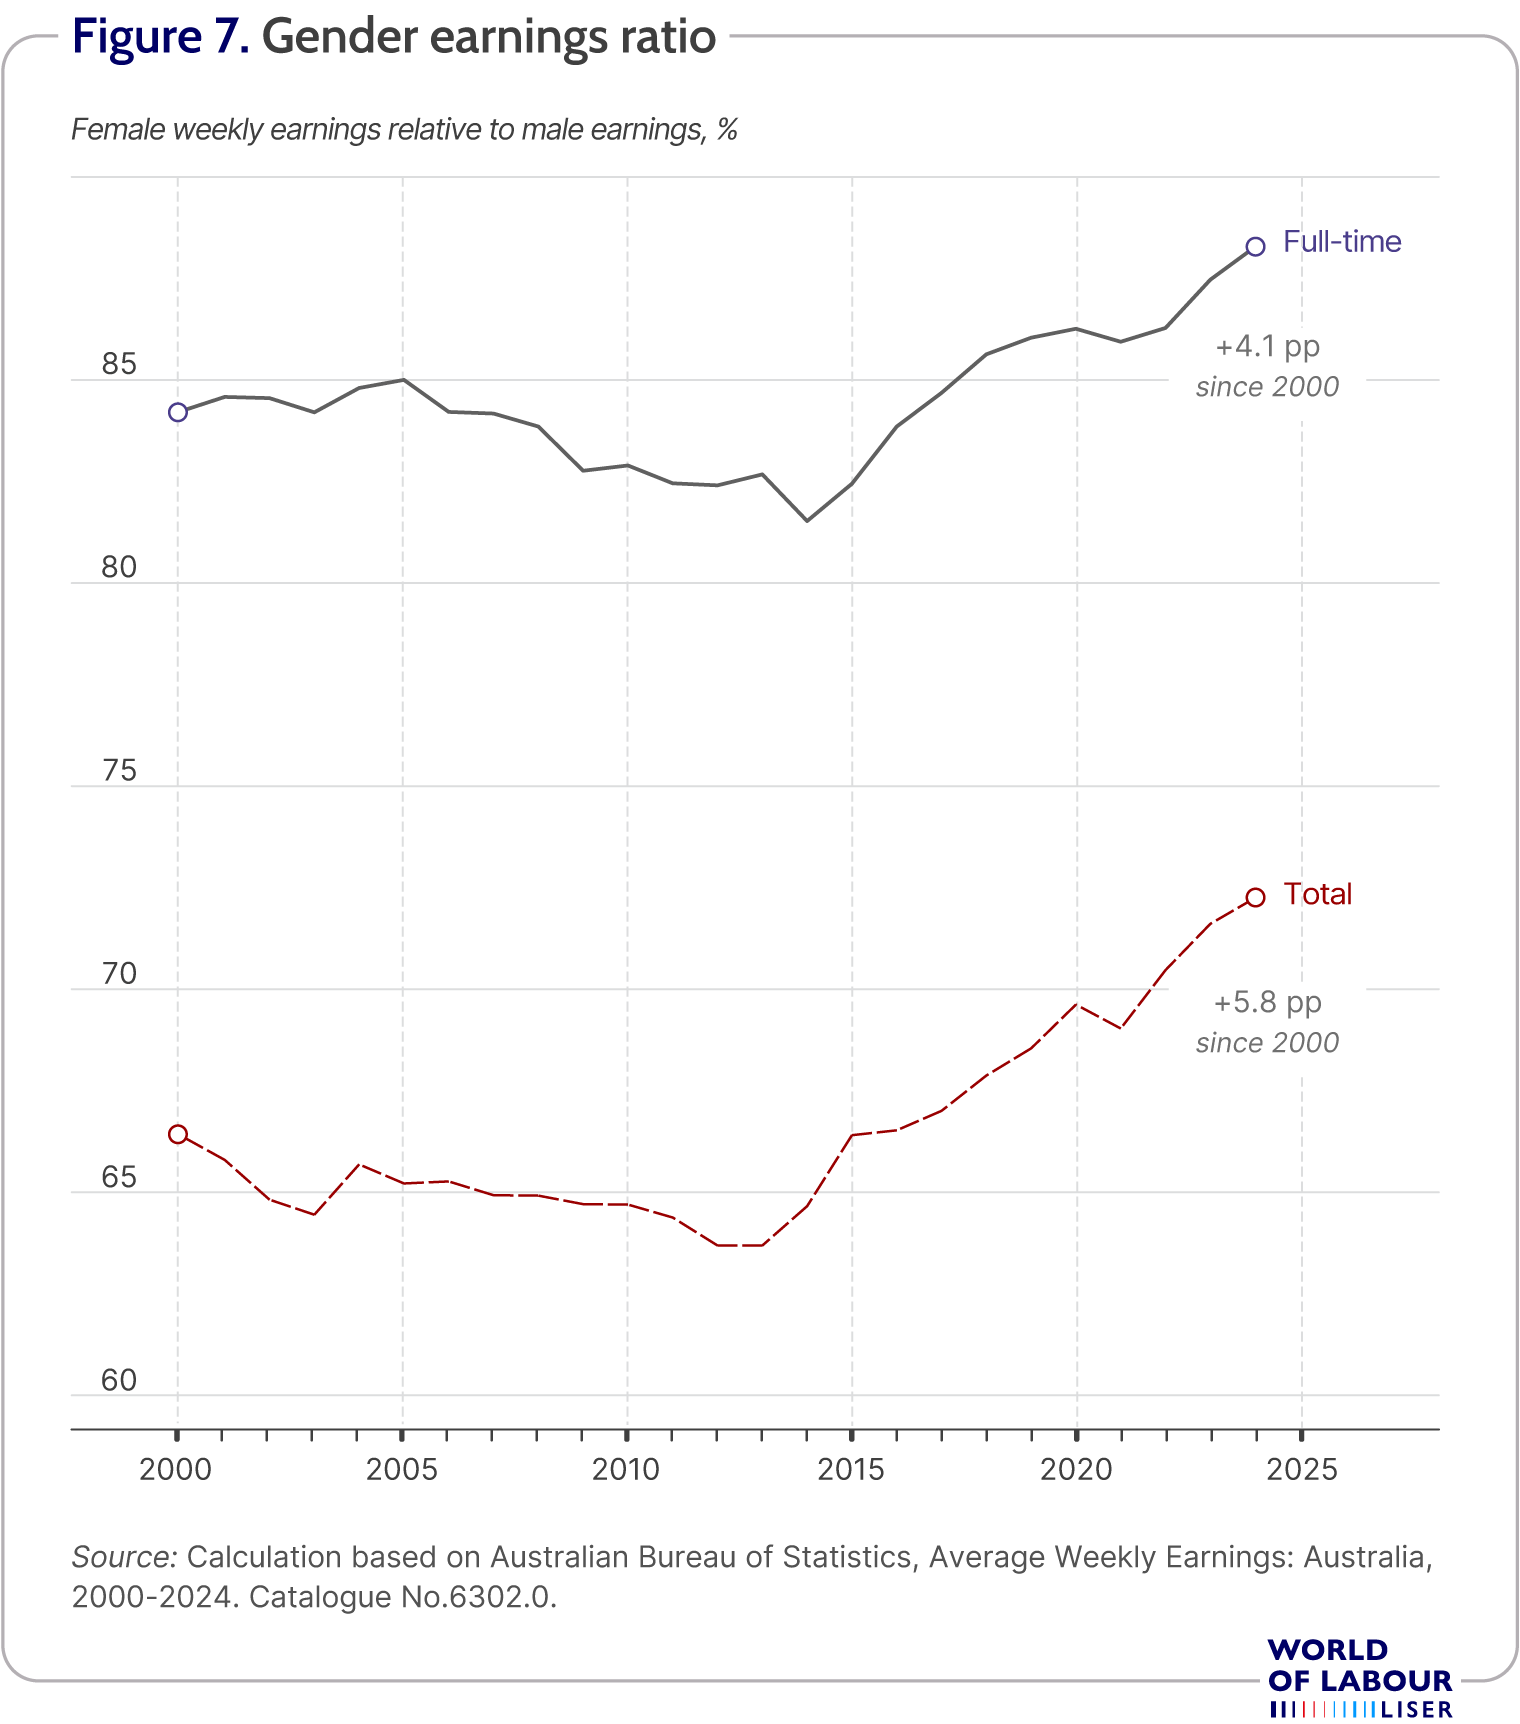
It is important to consider trends in earnings for different groups in the labour force. Figure 7 presents the mean female weekly earnings as a percentage of male weekly earnings. Series for both mean total earnings and mean full-time ordinary earnings are shown. The relative mean total earnings series varies between 63% and 72%, and the relative mean full-time ordinary earnings series varies between 81.5% and 88.3 %. The pattern shows a mild deterioration to the early 2010s, followed by steady gains from about 2015 (with a small dip in 2021) culminating in new highs in 2023–24. Overall, gender gaps narrowed by roughly 5.8 percentage points for total earnings and 4.1 percentage points for full-time ordinary earnings since 2000; however, a noticeable gender earnings differential remains.
 Female–male differences in unpaid work
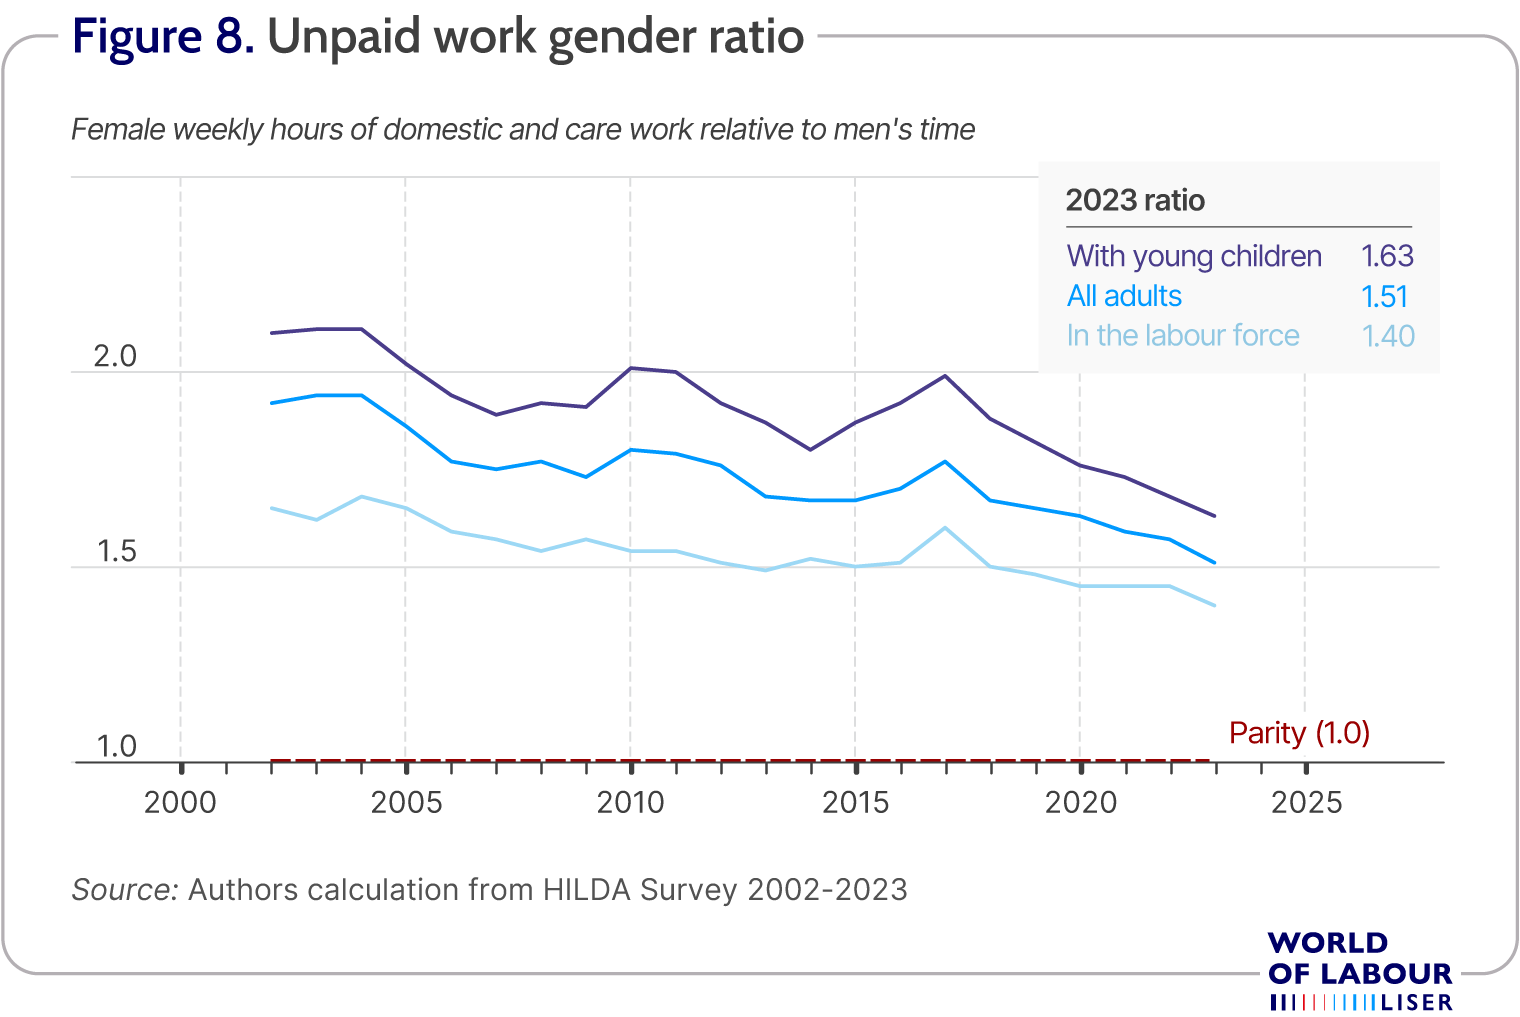
Time-use evidence shows also stark gender differences in unpaid work. While the ABS no longer fields regular time-use surveys, the nationally representative Household, Income and Labour Dynamics in Australia (HILDA) Survey collects weekly hours of domestic and care activities. Figure 8 plots the female-to-male ratio of unpaid child-care and domestic work, shown for all adults, those in the labour force, and those with young children. On average in Australia, women spend about 1.7 times as many hours on unpaid care and domestic work as men; among parents with young children, the gap averages around 1.9 times. Although the ratio has trended down since the early 2000s, the gap remains substantial: in 2023 women still do approximately 50% more unpaid work overall; 40% more among those in paid work and 63% more for parents with young children. This disproportionate share of unpaid care and family responsibilities is a continuing barrier to women’s labour force participation and earnings progression.
 Working past 65
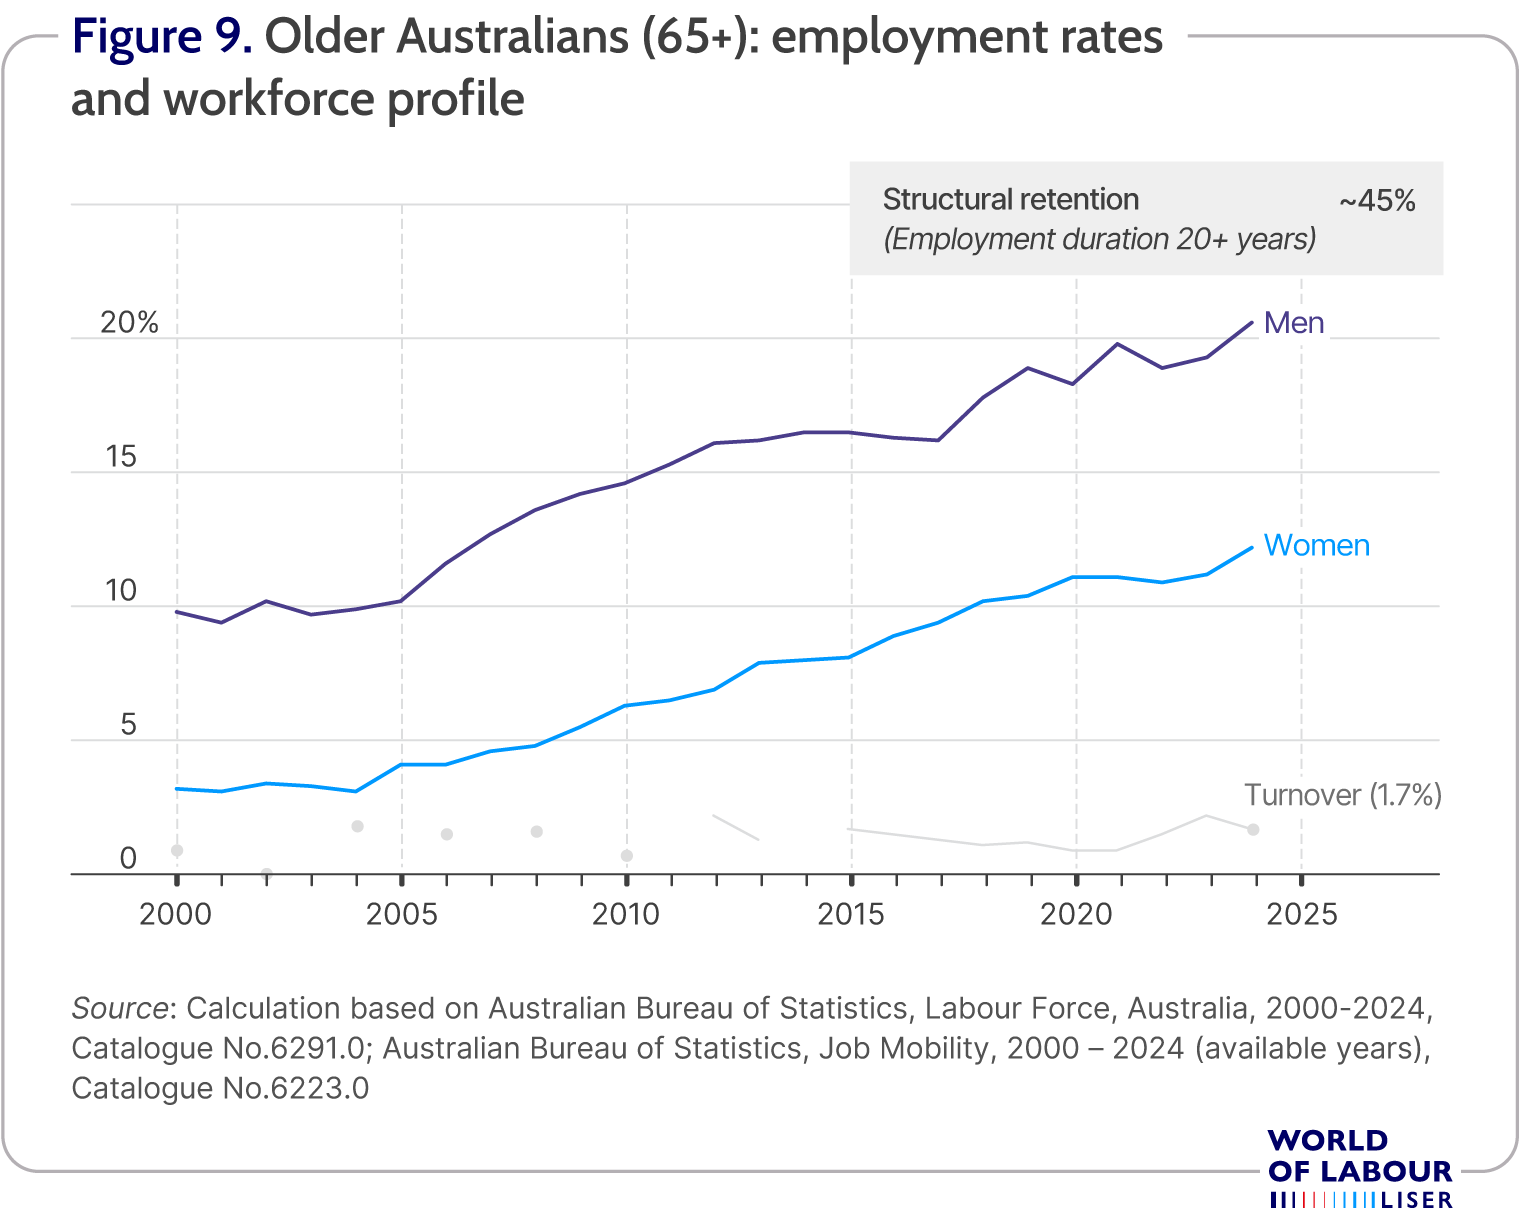
An important shift in Australia’s labour market is the rise of work at ages 65+, a group traditionally excluded from the “working-age” lens. Pension reforms that lifted the Age Pension eligibility age have coincided with markedly higher participation at older ages. As Figure 9 shows, the female age 65+ employment rate has risen roughly four-fold since 2000 to around 12%, while the male rate has doubled from 9.8% to 20.6% in 2024, unprecedented historical highs for both series. Among those employed at ages 65+, around 45% have 20 or more years’ tenure with the same employer, suggesting employment is sustained largely by incumbent workers extending their careers, with relatively little new entry at these ages. Turnover is very low: in 2024, only about 1.7% of 65+ workers changed jobs (compared to roughly 5.3% for ages 45–64). These trends argue for age-smart job design: invest in task redesign, reduced physical strain, and flexible scheduling (shorter workweeks, seasonal peaks, phased retirement) to retain 65+ workers without sacrificing productivity.
 Changing income inequality
When examining social welfare, it is important to consider aspects of the distribution of earnings or income. The ABS does not publish statistics on weekly earnings beyond the mean. However, it does conduct household survey programmes that measure a range of income concepts, for which distributional measures are published.
Figure 10 presents simple and informative descriptive measures of inequality by showing the ratio of earnings at different income distribution percentiles. The calculated ratios include the 80/50 (that is the 80th percentile compared with the median or 50th percentile), the 80/20, the 50/20, and the 50/10 ratios. The figure presents the time series for these distributional measures for equivalised household disposable income for the period 2011/12 to 2021/2022, whereby split years are shown because the survey covers fiscal years, that is July to June, rather than a calendar year.
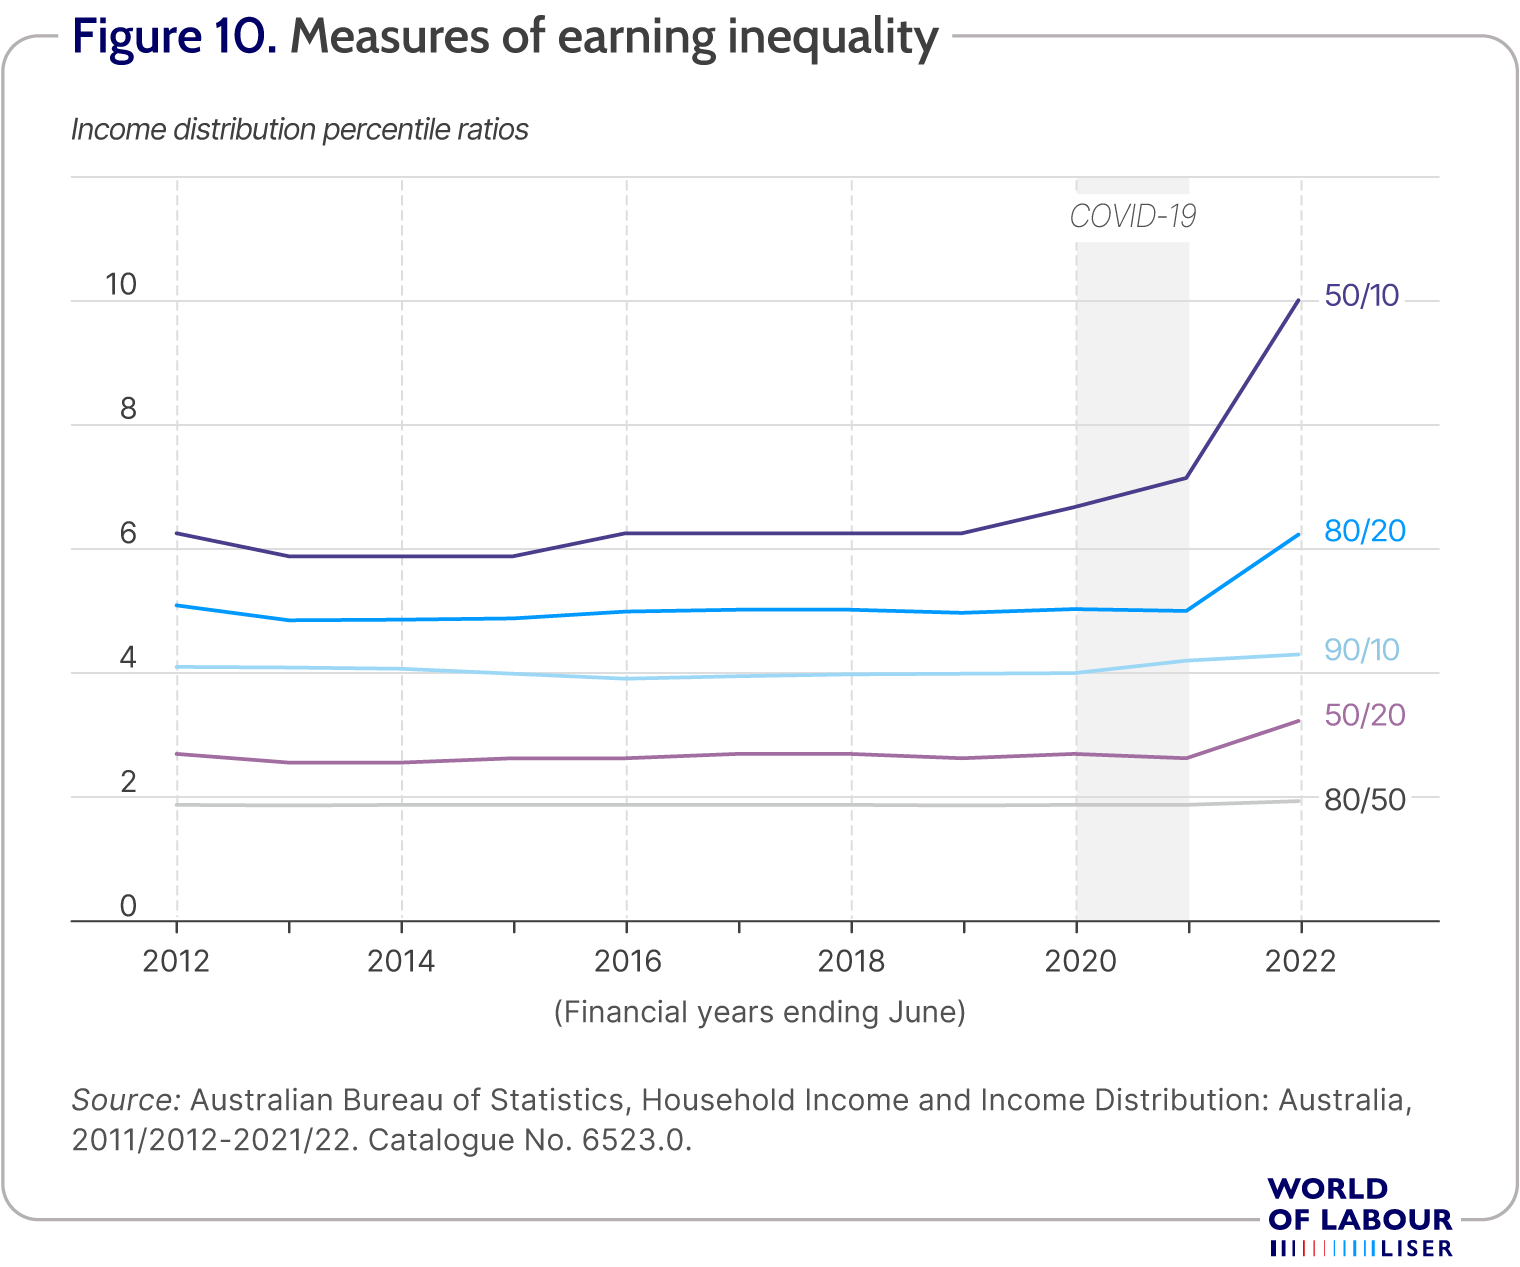 As in many advanced economies, Australia experienced rising inequality over the late twentieth century [6]. Since 2000, however, household income dispersion was broadly stable through most of the 2010s: the middle of the distribution changed little, as indicated by a flat 80/50 ratio. The pattern shifts around the pandemic. After a brief compression during the initial support phase, inequality widens as supports unwind—driven by the tails rather than the middle—with 90/10 widening and 50/10 signalling a weaker bottom, while median-anchored measures remain comparatively flat. This is consistent with stronger post-pandemic gains at the top and a softer recovery at the bottom. Administrative tax evidence likewise points to only a modest rise in top income shares, with changes concentrated within the very top percentile [7].
Institutional reforms and labour market outcomes
Since the 1990s, the Australian labour market has evolved from a relatively centralised wage-setting system towards a more decentralised bargaining model anchored by a statutory safety net. Reforms through the 1990s formalised enterprise bargaining and progressively repositioned industry awards as a minimum floor for pay and conditions, rather than the primary determinant of wages [8]. This broad architecture was consolidated under the Fair Work Act 2009, which strengthened the statutory floor through the National Employment Standards and embedded a modernised award system. In the most recent period, legislative change has tended to move in a re-regulatory direction with greater emphasis on job quality and compliance, most visibly through stronger enforcement against underpayments and the introduction of a “right to disconnect”.
Although concurrent macroeconomic stabilisation and other structural reforms make it difficult to attribute aggregate labour market performance to any single institutional change, the post-1990 framework is widely viewed as broadly flexible and compatible with strong employment outcomes. The OECD assesses Australia’s labour market performance favourably by advanced-economy standards, while noting growing concerns for job quality and distributional outcomes [9].
A central policy question is whether the safety net, particularly awards and national minimum wage adjustments, raise wages at the bottom of the distribution at the cost of employment. The available microeconomic evidence suggests that Australia’s safety net lifts wages with limited employment impacts, at least for the incremental changes that have been observed in practice [10].
Beyond the level of the wage floor, the structure and coverage of bargaining have become increasingly salient for wage dynamics. Enterprise agreement coverage has declined since around 2010, with greater reliance on awards, potentially weakening wage dynamism [11]. In this vein, the Reserve Bank of Australia also emphasises that wage outcomes may be increasingly shaped by factors outside formal industrial relations settings.
Clearer causal evidence of the impacts of institutional reform relates to retirement policy and mature-age labour supply. Quasi-experimental studies exploiting changes in Age Pension eligibility show that lifting eligibility ages delays retirement and increases labour force participation at older ages [12]. Recent evidence shows that pension incentives matter for household decisions, affecting the joint retirement of couples [13].
Overall, Australia’s labour market framework has combined decentralised bargaining with a robust statutory safety net in a way that has supported high participation and comparatively low unemployment. The safety net appears effective at raising wage floors without clear evidence of job losses for the policy changes observed to date, though the decline in collective bargaining coverage presents a challenge for wage growth and wage-setting dynamism. Meanwhile, retirement policy reforms have well-established effects on labour supply, whereas the employment consequences of the latest reforms remain an important agenda for future evaluation.
Limitations and gaps
The key limitation of Australian labour-market evidence is the lack of detailed, consistent distributional data on earnings, income, and time use. The ABS provides high-quality statistics on labour-force status by demographic group, but information on earnings beyond mean weekly earnings by gender is limited, and time-use surveys are no longer fielded. This makes it more challenging to track contemporary distributional developments, especially for detailed demographic groups, such as youths and the elderly, the native-born and immigrants, or by broad skill attainment levels. This gap in fundamental evidence introduces a time lag in policy development. While HILDA offer valuable insights, Australia urgently needs a regular national time-use survey to monitor unpaid work, care, and daily activity patterns—evidence that would materially strengthen labour-market monitoring and policy evaluation.
Summary and policy advice
The Australian economy and labour market have, on balance, performed strongly over the past two decades. After solid gains through the 2010s, the Covid-19 shock in 2020 produced a brief but sharp contraction, followed by an unusually rapid recovery: unemployment fell to multi-decade lows in 2022–23, participation reached record highs, and employment growth remained robust into 2024–25. Real earnings dipped in 2022 amid high inflation but began to recover as nominal wage growth firmed in 2023–24. A notable structural shift over this period is the secular rise in 65+ participation, especially among women. With pension-age reforms now fully phased in and more flexible work models more common, retaining experienced workers at older ages is a practical way to support output while easing pressure on income-support programs.
One clear drawback to the overall success of the labour market is that economic prosperity has not been equally shared. The burden of unemployment is concentrated among specific sections of the labour force. Following the post-commodities-boom slowdown, long-term and very-long-term unemployment increased. The Covid-19 shock then produced a brief spike in 2020, followed by a rapid recovery to multi-decade lows by 2022. Since then, unemployment has risen modestly in 2024, and pockets of long-term joblessness persist. Developing effective labour market policies to address the problems of long-term unemployment remains an important priority for policymakers.
Finally, there is a relative paucity of detailed and timely data on the earnings and wages of Australian workers. Enhancing the monthly Labour Force Survey with questions on earnings would help bridge this major gap in basic knowledge. Based on the information available, since 2000, earnings growth has been moderate, and the gender earnings gap has not improved. It also appears that household income inequality has remained stagnant during this period, while recent evidence indicates substantial growth among the very top income shares. Taxation and transfer policies are thus important instruments for addressing income inequality, by curbing excessive growth at the very top of the income distribution and improving the progressivity of the system.
Acknowledgments
The authors thank the anonymous referee(s) and the World of Labour editors for helpful suggestions on earlier drafts. Version 2 of this article adds new evidence, updates all figures, and adds news references.
Competing interests
The World of Labour project is committed to the European Code of Conduct in Research Integrity. The authors declare to have observed the principles outlined in the code.
© Kadir Atalay and Garry Barrett


