Elevator pitch
Finland's population is aging rapidly by international comparison. The shrinking working-age population means that the burden of increasing pension and health care expenditures is placed on a smaller group of employed workers, while the scope for economic growth through increased labor input diminishes. Fiscal sustainability of the welfare state calls for a high employment rate among people of working age. Recent increases in employment contribute favorably to public finances, but high overall unemployment and a large share of the long-term unemployed are serious concerns.
Key findings
Pros
Labor force participation and employment rates of older groups have increased considerably.
Although unemployment is at a relatively high level in the aftermath of the financial crisis and subsequent recession, it could be much higher, particularly considering the larger effect of the recession in the 1990s.
The unemployment rate declined rapidly from 2015 through 2018.
The gender wage gap has declined, although this is partly due to job losses among men in the recession years.
Wage inequality has remained stable and it is still low compared to most other advanced countries.
Cons
The employment rate among the working-age population is low compared to other Nordic countries.
Long-term unemployment, underemployment, and disguised unemployment remain high.
GDP remained below its 2008 level until 2016, and real earnings have hardly increased since 2010.
Some indicators point to a growing gap between the skills needed in new jobs and the skills possessed by unemployed job-seekers.
Author's main message
In 2016, the Finnish economy finally returned to a strong growth path after an almost decade-long stagnation. As a result, the unemployment rate declined by 2.1 percentage points from 2015 to 2018. However, the current employment rate is well below the government's target of 75% for 2023. In 2018, unemployment was still as high as 7.5% and a large share of job-seekers had been without a job for over a year. Moreover, a significant part of unemployment may be structural. Several labor market reforms to increase employment have already been implemented, but new ones, such as promoting longer working careers and flexible work arrangements, increasing flexibility in wage setting, or encouraging immigration, may be needed.
Motivation
The share of the population aged 65 and over is increasing in all EU countries. In Finland, this share rose by 4.5 percentage points (pp) over the past ten years, which is the second highest increase in the EU after Malta, and more than twice the EU28 average. To cope with the financial pressures associated with an aging population, several labor market reforms have been implemented since 2000. The reforms aimed to increase employment by lowering unemployment, encouraging labor market entry, and postponing retirement. These reforms have influenced how the labor market responded to a severe and lengthy recession that hit the economy in 2008 and lasted nearly a decade.
Discussion of pros and cons
Aggregate issues
In Finland, the number of working-age people (aged 15–64) is already shrinking, and the overall population aged 15 to 74 will start to decline in 2020. Moreover, no increase in the size of the working-age population is forecast before the 2040s. The population share of working-age people is expected to decline from the present level of 62% to 57% by 2060 [1]. This demographic change leads to increasing pension payments and health care expenditures. There is a consensus among policymakers, labor unions, and employer organizations that labor supply and employment among the working-age population must increase to cope with these growing financial pressures. This calls for a well-functioning labor market, producing high employment and, in turn, sufficient tax revenues and social security contributions to support the country's aging population. Toward this end, several reforms have already been implemented, such as those in pension and unemployment benefit schemes, but additional reforms are still needed. Despite the common goal of a higher employment rate, the effectiveness of potential policy measures to boost employment and labor supply remains open to debate.
The key goal of the current government is to increase the employment rate among the working-age population to 75% by 2023. Given that the employment rate has not been that high in Finland for decades, the target is very ambitious. However, the target level is lower than current employment rates in other Nordic countries, suggesting it is not unrealistic in the longer term. The government has also pledged to increase employment by 60,000 people.
The employment rate increased from 66.9% in 2000 to 70.6% in 2008 (Figure 1). Over the same period, the unemployment rate declined from 9.8% to 6.4%. However, the development reversed in 2008 when the global financial crisis hit, and remained poor for almost a decade. By 2015, the employment rate dropped to 68.1% and the unemployment rate rose to 9.6%. In the following years, the economy strengthened, and the employment rate increased to 71.7 % and the unemployment rate declined to 7.5% by 2018.
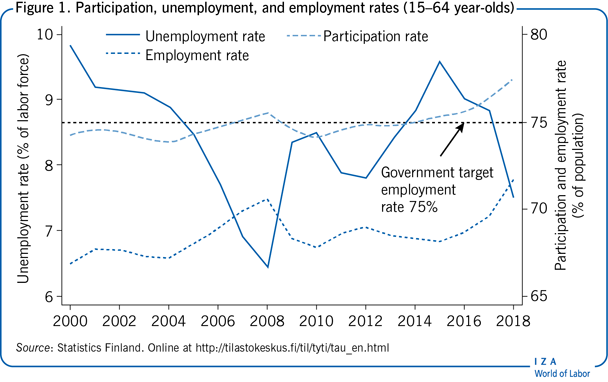
At the beginning of the new millennium, the labor force participation rate was relatively stable, varying between 73.8% and 75.5% over the years 2000–2009. Since 2010 it has been increasing steadily, reaching 77.5% by 2018.
It is worth emphasizing that the Finnish economy was hit exceptionally hard by recent events, not only by the Great Recession, but also by the meltdown of the Nokia-dominated tech cluster, structural change in the forest industry, and more recently by sanctions between EU and Russia. As a result, GDP remained below its 2008 level up to 2016, with an average annual GDP growth rate of –0.1% from 2008 to 2016. Given almost ten years of economic stagnation, an increase of 2.6 pp in the unemployment rate between 2008 and 2016 is not that bad. The increase is actually moderate, especially when compared to the evolution of unemployment during and after the previous deep recession between 1990 and 1994, when GDP declined by 6% and unemployment skyrocketed from 3.2% to 16.7%. Furthermore, the unemployment rate remained above 10% until 1999, when GDP exceeded its 1990 level by 17%.
Fortunately, in recent years, unemployment has reacted promptly to improvements in economic conditions. GDP growth was relatively strong from 2016 through 2018, at an average annual rate of 2.5%, and the unemployment rate declined by 2.1 pp. It is unclear to what extent this decline is driven by changes in the macroeconomic environment and to what extent by economic policy. In mid-2016, employer organizations and labor unions agreed on the “Competitiveness Pact.” The Pact introduced a wage freeze for 2017, reduced employers’ indirect labor costs, cut holiday bonuses for public sector employees, and extended annual working time by 24 hours without additional compensation. This Pact has possibly encouraged hiring by lowering wage costs and boosted economic growth by improving Finnish firms’ competitiveness.
Labor force participation, unemployment, and employment by gender and age
One of the positive developments in recent years has been the increased labor force participation rate among older age groups (Figure 2). Apart from the cyclical variation, the participation rate among working-age men remained quite stable until 2015, while among working-age women it increased by about 2 pp during 2000–2015. Having dipped during the recession, in 2015 the participation rates of both and women were back at their 2008 levels. Participation rates rose notably from 2015 to 2018, by 1.9 pp among men and 2.1 pp among women.
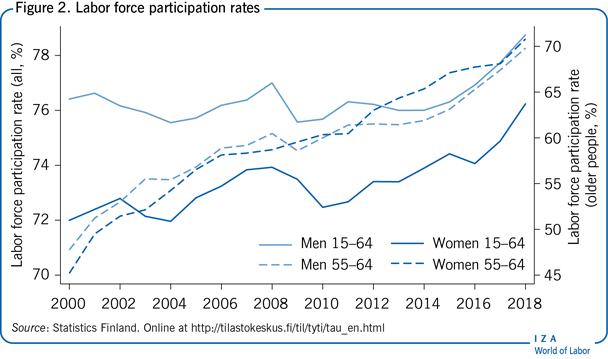
Women's participation is rather high, and the difference between men and women is quite small compared to most other countries. The gender difference has also shrunk further during the time period under consideration. The large involvement of women in the labor market can at least partly be attributed to a well-established parental leave system and the provision of public daycare. However, the Finnish homecare allowance system induces mothers to care for their children at home for longer periods than in other Nordic countries. The participation rate of women with children between the ages of one and three is clearly less than in, for example, Sweden, but in Finland women with children of all ages work mostly full-time, whereas part-time work is much more prevalent in other Nordic countries.
The aggregate numbers hide important differences between the participation rates among different age groups. The participation rates of people aged 55–64 have increased markedly since 2000, by 22 and 26 pp for men and women respectively. This has been influenced by factors such as reforms in the pension system. The most effective reforms have been the abolition of a disability pension scheme with relaxed medical eligibility conditions and increases in the age threshold for an early retirement scheme that offers unemployment-related benefits until old-age pensions are provided.
The increase in the participation rates of those aged 55–64 is due primarily to increases in their employment rate (Figure 3). The pension and unemployment insurance reforms seem to have had a significant effect on employment in this age group [2]. However, employment rates for the whole working-age population are well below the government's target rate of 75% despite the sharp increases over the past two years. Furthermore, while the employment rate for women is close to that in other Nordic countries and above the EU average, the employment rate for men is lower than in other Nordic countries [3].
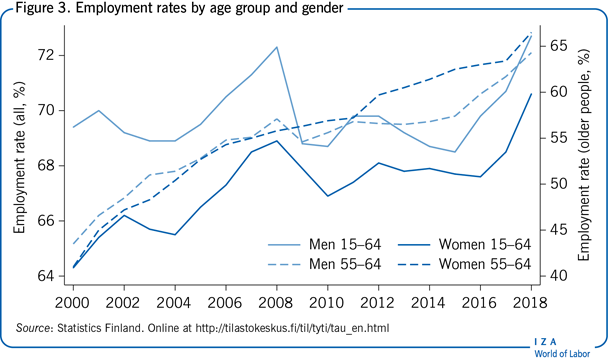
The employment rate of working-age women increased by 6.3 pp between 2000 and 2018. By contrast, men's employment suffered more from the recession, and the employment rate of working-age men was back to its 2000 level in 2016. Since 2015, their employment rate has been increasing rapidly and it reached 72.7% in 2018, which is 3.3 pp higher than in 2000.
Several policies to increase the employment rate (e.g. changes in the unemployment compensation system and a reduction in employers’ indirect labor costs) have been implemented in recent years. However, since economic growth is expected to slow down and remain sluggish in the coming years, it is unlikely that the overall employment rate will reach the target level of 75% without further measures.
Unemployment in all age groups was still high in 2000 following the recession in the 1990s (Figure 4). The rate for people under 25 shot back up to those levels when the recession began in 2008, and in 2015 it was still above 22%. Since then unemployment among this group has declined drastically. By 2018, their unemployment rate had declined by 5.5 pp to 16.9%. As usual, for workers older than 25 the developments following the recession were slightly more moderate than for younger workers. However, with economic growth absent for almost a decade, in 2015 the unemployment rate for men over 25 exceeded its rather high 2000 level. Women suffered slightly less from the recession due to gender differences in the employment shares within the most affected industries. Over 2015–2018, the unemployment rate among both men and women older than 25 declined by about 1.5 pp.
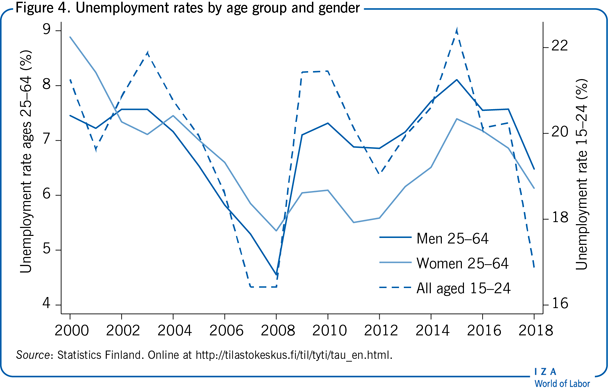
Considering the long-lasting economic stagnation, the increases in unemployment rates over the years 2008–2015 for different age groups are not remarkable. One explanation could be that the number of hours worked decreased, thus absorbing part of the blow of the recession. However, while working hours have indeed decreased, this development began 20 years ago and the connection to the unemployment rate is far from obvious [3]. Moreover, the demand shock due to global turmoil fell mainly on the capital-intensive export sector, while the labor-intensive service sector was less affected. Unlike in the early 1990s, firms had very strong balance sheets at the beginning of the 2008 crisis and interest rates remained extremely low over the recession years, which reduced the need for mass layoffs. In light of the relatively small increases in the unemployment rate following the 2008 crisis, the decline in unemployment from 2015 to 2018 has been fast.
As in other countries, the high unemployment rate among younger workers is worrisome. However, the unemployment rate is not an ideal indicator of the situation of young workers, due to low labor force participation and the high share of students among the officially unemployed in this age group. The NEET (not in education, employment, or training) rate gives a clearer picture of how young adults are faring. In Finland, the NEET rate for 20 to 24-year-olds increased by 4 pp between 2008 and 2016, reaching 14.1%, but fell back to 11.8% by 2018. Among non-employed 20 to 24-year-olds the share in education fell from 65% to 59% between 2008 and 2016 but had risen to 64% by 2018.
Wage developments
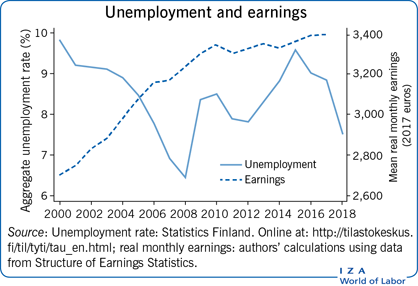
The data used here to analyze wage developments come from the Structure of Earnings Statistics compiled by Statistics Finland and are formed by combining data collected by employer organizations from their members with those from Statistics Finland's wage and salary inquiries. The records cover 55% of private sector employees and 100% of public sector employees. Firms with fewer than five employees, firms in agriculture and forestry, and the top management of firms are not included. Sampling weights are used to make the data representative for the population of private sector firms covered by the inquiries. The weighted data represent 80% of employees in Finland. The main reason for using these data, as opposed to register data for the whole population, is that the population-wide register data only include annual earnings without information about full-time or part-time employment.
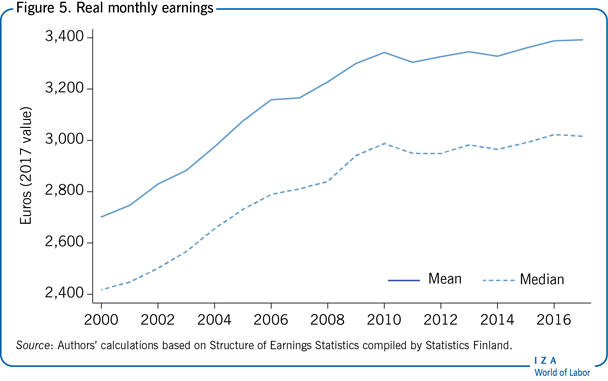
Examining monthly earnings of full-time employees provides a clearer picture of the evolution of wage inequality and, due to the low prevalence of part-time work in Finland (only 10% of men and 20% of women work part-time compared to about 15% of men and 35% of women in Sweden and Denmark [3]), does not significantly restrict the sample. The development of real earnings has two distinct periods, with continuous growth until 2010 and hardly any change since then (Figure 5). In 2008 and 2009, wages continued to increase at a rapid rate despite large drops in output and productivity, which contributed to a decline in the cost-competitiveness of Finnish firms. This has been seen as a failure of the highly centralized wage setting system.
In Finland, collective agreements are signed between labor unions and employer associations at the industry level. These agreements are automatically extended to also cover most non-union workers and their employers. As a result, 89% of workers are covered by collective bargaining. Quite often, industry-specific agreements have been made according to a comprehensive settlement between the confederations of labor unions and central employer organizations (possibly with government intervention regarding labor taxes or employment regulations), in which case roughly equal wage increases have been paid to all employees.
The highly centralized wage bargaining system has been criticized in past years. It has been argued to be too inflexible for the current economic environment, resulting in nominal wage rigidity and preventing wages from adjusting to asymmetric demand shocks and productivity differences. Employers, in particular, strive toward a more decentralized system. In 2016, the Confederation of Finnish Industries (i.e. the umbrella organization of 26 employer associations) changed its internal rules in such a way that it cannot anymore sign central-level wage agreements on behalf of its members.
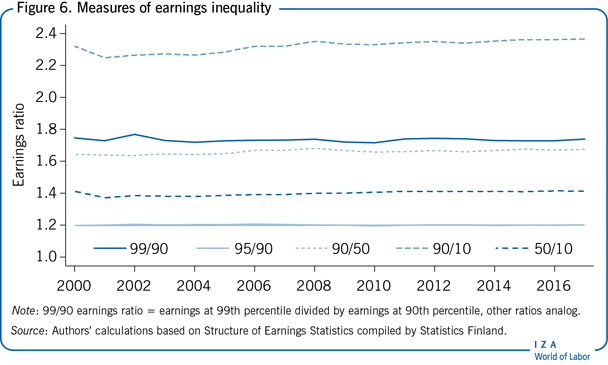
To examine the development of earnings inequality, the earnings ratios (99/90, 90/50, 90/10, 95/90, and 50/10) for individuals at different percentiles of the earnings distribution are reported (Figure 6). The top management of private firms are not included in the data, which may impact the 99th percentile of the earnings distribution. What stands out is the flatness of all the measures considered, with none of the rise in earnings inequality found in, for example, the US and Germany. Accordingly, overall earnings inequality is rather low in Finland compared to most other countries and has not been increasing.
The female/male earnings ratio increased among full-time workers over 2000–2017, with most of the increase occurring during the recession. Women with tertiary education gained more than less-educated women but are still relatively worse off compared to their male peers (Figure 7). Gender differences are slightly smaller in the private sector than in the public sector. In the private sector the female/male earnings ratio has continued to rise, while in the public sector it is at approximately the same level as in 2011.
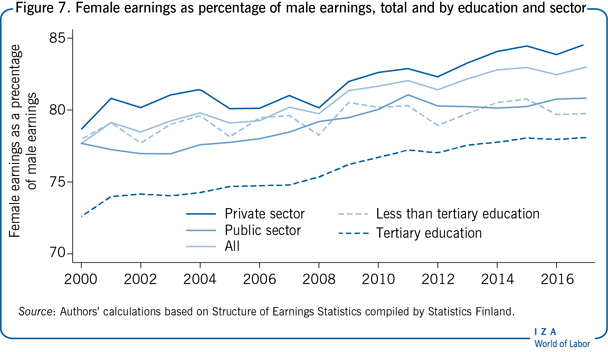
Most of the overall increase in the female/male earnings ratios appears to be a composition effect. When restricting the sample to employees who are present in the data in both 2000 and 2017, the path of the female/male earnings ratios, both overall and in the sub-groups, is almost flat. The recession had a particularly severe effect on employment in some male-dominated industries, such as in forestry and the metal and electronics industries, which influences the measures of gender differences in earnings.
Some evidence of mismatch between job-seekers’ skills and job requirements
GDP grew around 1.7% in 2018, having grown slightly faster in the two previous years, and growth is expected to slow down further over the next few years. During the years of relatively strong growth, unemployment declined and employment increased. But, while the decline in unemployment has been rapid, the unemployment rate is still relatively high at a moment when economic growth is slowing down. There are several reasons for this somewhat unfortunate situation.
First, the share of long-term unemployed is still quite high. It is well known that people who have been unemployed for a long time have relatively poor employment prospects due to the depreciation of human capital and as employers tend to discriminate against the long-term unemployed. The share of unemployed people reporting themselves as long-term unemployed (i.e. as having been looking for a job for over 12 months) in the Labor Force Survey (LFS) is still 6 pp higher than in 2009 (Figure 8). The share of long-term unemployed on registers of the Ministry of Economic Affairs and Employment (MEAE) is even higher, although it fell by 5 pp from 35% in 2016. The MEAE long-term unemployed also include individuals who are not actively searching for work and thus potentially at risk of permanent unemployment.
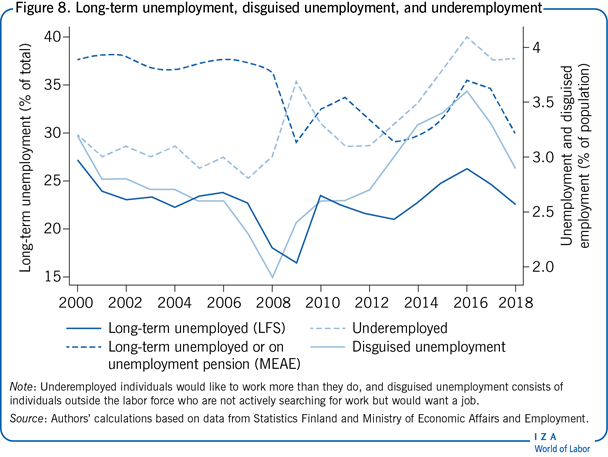
Second, the share of underemployed and those in disguised unemployment remains rather high, although the latter has declined somewhat in the last two years. Underemployed individuals would like to work more than they do, and disguised unemployment consists of people outside the labor force who are not actively searching for work but would want a job. The size of these groups points to hidden labor supply potential, which might be good for the economy as a whole and for the government's employment rate target, but also means that unemployed job-seekers will face tougher competition for vacant jobs. Part of the increase in employment in the last couple of years is linked to transitions from disguised unemployment to employment, which attenuates the apparent effect of improved employment conditions on the decline in official unemployment.
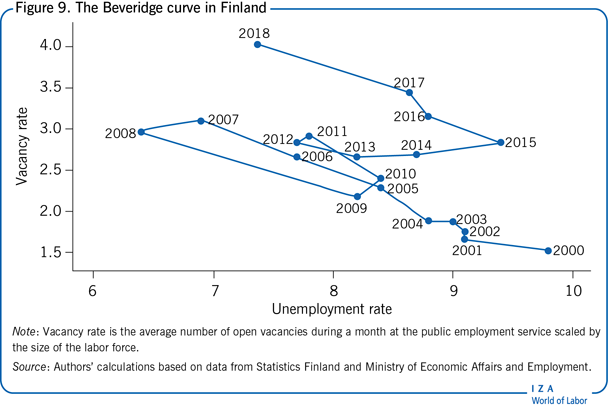
Third, there is some indication that unemployed workers’ skills have not matched very well to the requirements of new jobs over the past few years. One piece of evidence for this comes from Finland's Beveridge curve—a graphical representation that describes the degree of mismatches between available jobs and unemployed job-seekers in a labor market, obtained by plotting the vacancy rate against the unemployment rate over time. Business cycle variation produces a downward-sloping relationship for this curve as vacancies increase and unemployment declines during upturns, whereas vacancies and unemployment move in the opposite directions during downturns. If the curve moves outwards (i.e. when a given vacancy rate is associated with a higher level of unemployment), this implies that vacant jobs are filled by unemployed job-seekers at a lower rate. Such a shift in the location of the curve can be regarded as evidence of an increase in structural unemployment, which may happen because the skills of the unemployed and the skills required in jobs do not match, or because vacant jobs and unemployed job-seekers are located in different parts of the country.
The number of vacancies in Figure 9 refers to the average number of vacancies reported by the public employment service during a month, which is scaled by the size of the labor force, obtained from the LFS. Because not all open vacancies are reported to the public employment service, the vacancy rate underestimates the total number, possibly to a large extent. Nonetheless, its changes over time are likely to describe labor demand changes sufficiently well. The points in the graph move approximately along a downward-sloping line from 2000 to 2013, though the 2008 and 2009 points are somewhat off the line and closer to the origin. The movements until 2013 can be explained mainly by variation in business cycle conditions. However, the curve clearly shifted outwards in 2014 and 2015, as the unemployment rate increased by over 2 pp even though the vacancy rate remained stable or increased marginally, pointing to increasing labor market mismatches.
Additionally, the increase in the share of people in disguised unemployment in 2008–2016 may imply a worsening mismatch problem—people may stop looking for a new job if they think that they lack the skills required or if they live in regions where no jobs are available and are unable to migrate. On the other hand, differences in unemployment rates across Finnish counties have not increased during the past few years. In fact, regional differences were larger during the first years of the 2000s than they are now.
It is noteworthy that in Finland people with poor skills have particularly low employment rates but relatively high wages, while in several other countries skill differences translate into wage differences [3]. Although the share of people with poor skills is relatively low in Finland (at 7% compared with 12% in Denmark and 16% in the US), this group's relatively high wages indicate that education or increased flexibility in wage setting could play an important role in enhancing their employment.
The low-skilled group which faces difficulties in the Finnish labor market includes part of the immigrant population. The share of foreign-born residents is currently only 7%, but has increased rapidly in recent years, having been practically zero before the 1990s. The average employment rate of foreign-born residents is currently clearly lower than for natives at 57.7% [4], but this observation masks substantial variation depending on the background of the immigrant. While the employment rate of 20 to 64-year-old immigrants who originally came to the country to work was 86% in the most recent (2014) survey, those arriving as refugees had an average employment rate of only 39% [5]. These figures obviously hide further differences that arise from the length of stay in the country, as well as significant gender differences, with the employment rate of foreign-born women lagging that of men. In addition to improvements in the integration and education services available to immigrants, flexibility in wage setting might provide immigrants with skill shortages easier access to the labor market and subsequently lead to improved overall integration.
Limitations and gaps
One limitation in describing labor market conditions over time is the lack of comprehensive data on labor demand conditions. This analysis used data on open vacancies at the public employment service, published by the MEAE. An advantage of this approach is that the underlying microdata are readily available. However, the data only cover a portion of open vacancies in the labor market, and the vacancies included are somewhat selective, with high-skill jobs probably underrepresented. An alternative source of data would be the Job Vacancy Survey, conducted by Statistics Finland, which is based on EU-wide guidelines. The problem with this survey is that it only goes back to 2002; also, its design changed in 2013, so that the most recent data are not comparable to pre-2013 data. Another limitation is related to the information on the basis of the residence permit of immigrants which is not available in the LFS or Statistics Finland register data and is only collected in infrequent surveys.
Summary and policy advice
The most obvious problem in the Finnish labor market today is high unemployment, which would be less worrisome without signs of its structural nature. Given demographic change, the major challenge is to reach a sufficiently high employment rate. There is no single solution; various measures to increase labor supply and employment among labor market participants are needed.
Policies to increase labor supply could include the promotion of longer working careers, such as providing economic incentives to postpone retirement, along with flexible work arrangements for those not able to work full-time due to health issues. Given the relatively poor labor market situation of young workers, ensuring a smooth transition between different stages of the education system and facilitating entry into the labor market can have a substantial impact in the long term. An additional way to increase labor supply is to encourage immigration, along with programs that foster integration in the Finnish labor market and society. As to policies that would increase employment among labor market participants, training programs for the unemployed with outdated skills, flexible work arrangements for parents of young children, and flexible benefit schemes for underemployed individuals should be promoted and developed for more efficient use.
Acknowledgments
The authors thank the IZA World of Labor editors for many helpful suggestions on earlier drafts. Version 2 of the article updates the content and figures to 2018.
Competing interests
The IZA World of Labor project is committed to the IZA Code of Conduct. The authors declare to have observed the principles outlined in the code.
© Tomi Kyyrä and Hanna Pesola