Elevator pitch
Measuring employment and unemployment is essential for economic policy. Internationally agreed measures (e.g. headcount employment and unemployment rates based on standard definitions) enhance comparability across time and space, but changes in real labor markets and policy agendas challenge these traditional conventions. Boundaries between different labor market states are blurred, complicating identification. Individual experiences in each state may vary considerably, highlighting the importance of how each employed or unemployed person is weighted in statistical indices.
Key findings
Pros
The definitions of employment and unemployment are simple and enhance comparability across time and space.
The unemployment rate is a very useful tool for macro analysis.
Experience-weighted measures can account for variation in work characteristics (e.g. working time) and job search behavior (e.g. duration of unemployment) across countries and years.
Alternative indices broaden information for policy making and may account for diverse value judgments.
Cons
Boundaries between labor market states are blurred.
The definition of employment ignores differences in work arrangements (e.g. part-time, discontinuous working time) that influence total work potential and well-being.
The definition of unemployment overlooks differences in search intensity and unemployment duration, despite their relevance for welfare losses and probability of finding a job.
Alternative indices require the development of appropriate statistical sources and their underlying methodology can be difficult for the general public to understand.
Author's main message
As life-long, permanent, full-time work is increasingly replaced by multiple job spells, often intertwined with periods of non-employment and engagement in non-market activities, it is worth revisiting the notions of employment and unemployment and broadening the set of labor force statistics. Headcount indices could be usefully supplemented by experience-weighted indices that account for people’s experience in labor market states (e.g. work intensity for the employed and search intensity or unemployment duration for the unemployed). This task likely implies collecting new statistical data, but would improve policy design and understanding of the labor market.
Motivation
Since the Keynesian revolution in economics and policy making, the policy objective of full employment has meant minimizing the share of workers unable to find a job, the involuntarily unemployed. The unemployment rate has also been the prime indicator of labor market slackness and inflation risk (through the Phillips curve). New policy concerns, such as gender equality or social security sustainability in the face of population aging, have gradually shifted the focus from lack of opportunities for the unemployed to low employment levels.
Undoubtedly, the criteria used to measure employment and unemployment have significant, if unnoticed, implications for policy making. More attention should be paid to their normative bases and to whether they stand up to the changes experienced by labor markets since they were set.
Discussion of pros and cons
In 1976, the US Commissioner on Labor Statistics questioned if economists should measure the doughnut (employment) or the hole (unemployment) [1]. Significantly, the US Full Employment and Balanced Growth Act of 1978 translated “the right to full opportunities for useful paid employment at fair rates of compensation of all individuals able, willing, and seeking to work” into achieving, in the medium term, a maximum unemployment rate of 3% for people aged 20 or over. This is but one example that unemployment was the main post-war worry for policymakers. As populations aged and growth slowed, attention gradually shifted toward monitoring employment as well. This is especially the case in Europe, at least since the 1993 European Commission white paper Growth, Competitiveness and Employment. Currently, the Europe 2020 strategy sets an employment rate target of 75% for the EU population aged 20–64.
This shift toward a focus on employment has had little effect on official statistics. Ascertaining one’s employment status is traditionally seen as relatively straightforward, while the difficulty lies in identifying who is actually seeking work among the entire group of jobless people—the truly involuntary unemployed. This has led statisticians to concentrate on the hole in order to separate the unemployed from inactive people who are outside the labor force.
Yet, the doughnut deserves attention too. Is one hour of paid work in the reference week sufficient to classify someone as employed, as set out in the ILO’s guidelines? This simple rule underscores the importance of having a paid job in a market economy, but overlooks how much time is spent at work. However, in evaluating living standards and actual labor potential, it matters a great deal whether people work 48 hours or only one hour per week, or whether they work on a permanent or temporary basis. New employment practices such as zero hours contracts and the gig economy challenge the simplicity of this rule [2].
Borrowing a distinction typically used in poverty measurement [3], there is both an “identification” issue—how someone should be classified—and an “aggregation” issue—how each unit should be weighted. Traditionally, in labor market statistics much effort is devoted to solving the first problem, whereas the second is set by constructing headcount measures (e.g. weighting people equally irrespective of whether they work for one hour or 48 hours). With these measures, the only way to account for the diversity in work arrangements, non-employment conditions, or unemployment spells is to enlarge the set of available indicators (e.g. considering average hours worked per employee)—the “dashboard approach.” Alternatively, it is possible to estimate experience-weighted indices, which weight individuals proportionally to the intensity of their labor market condition (e.g. hours worked, degree of labor market attachment).
The employed
In official statistics an employed person is someone in paid employment, including a family business, who, during the reference week, worked for at least one hour, or was temporarily absent due to personal (e.g. illness, holiday, parental leave) or economic reasons (e.g. industrial action, reduction in economic activity, suspension of production). A formal job attachment is essential. The employment rate is the proportion of the working-age population with a paid job: it is a headcount measure that disregards how working time and contract duration differ across the employed.
Looking at the 15 countries that formed the EU in 1995 (EU15), the employment rate of the population aged 15–64 rose by 7.1 percentage points (pp) between 1995 and 2016. This was accompanied by a steady growth in the share of temporary employees, which increased by 2.6 pp to reach 12.2% of total employment. (Unless otherwise indicated, the statistics cited in this article are drawn from the official websites of Eurostat and the US Bureau of Labor Statistics.) This trend should be captured by the employment rate, because in a continuous labor force survey (LFS) the probability of being classified as employed in the reference week correlates positively with the fraction of the year spent at work.
At the same time, the number of hours actually worked per week in the EU15 diminished. The time spent in main and second jobs decreased by more than two hours, from 38.5 hours in 1995 to 36.3 hours in 2016. The employment rate is insensitive to this change in working time, but it can be adjusted by a factor equal to the ratio of total average hours worked in main and second jobs to the average working hours of a full-time employed person. From 1995 to 2016, the resulting full-time equivalent (FTE) employment rate rose by 4.4 pp, one-third less than the unadjusted rate. This measure still hides a one-hour decline in the benchmark full-time working hours: fixing the benchmark at the 1995 level would further reduce the employment rate increase to 3 pp. In short, for any 100 people aged 15–64 in the EU15, seven more people were employed in 2016 than in 1995, but the additional working time was equivalent to that of only three full-time workers in 1995.
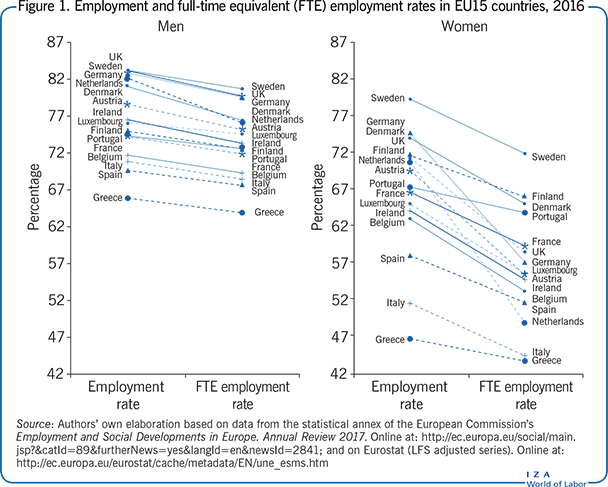
The adjustment for working time is equally relevant in comparing employment levels across countries. In 2016, the FTE employment rate in the EU15 was below the unadjusted rate among people aged 20–64, but the average difference was 9.6 pp for women against 2.9 pp for men. Accounting for the diverse spread of part-time work implies a very different country ranking for female employment rates: by far the lowest values are found in Greece and Italy, regardless of definition; but the downward adjustment when using FTE is large in Germany, Austria, the UK, and particularly the Netherlands, which tumbles from sixth to 13th place (see Figure 1).
As it is equivalent to the ratio of total actual hours worked to the hours that all working-age people would work if employed full-time, the FTE employment rate reflects the evolution in working times and contract lengths. However, it is also insensitive to the number of people employed and, more generally, to the distribution of work experience. All else being equal, the same rate is found for two economies with an equal total number of hours worked, even if the size of the employed pool differs. If, however, holding a job has intrinsic value, because it raises one’s self-esteem and social recognition and prevents ability decline caused by labor market detachment, then an economy in which more people are employed but work less might be socially preferable to one in which work is more concentrated.
This observation suggests that targeting either measure of employment implicitly assumes a specific social value of having a job: the standard employment rate values employment independently of the time spent at work; the FTE employment rate is concerned only with the aggregate amount of work, irrespective of the number of jobs, and values part-time work less than full-time work. Between these two extremes, there may be intermediate normative positions that recognize both the importance of time worked and the intrinsic value of having a job.
Alternative measures of employment
An experience-weighted index of employment can make these different value judgments explicit by assigning each employed person a weight proportional to his/her work intensity—a measure of the time worked with respect to a benchmark working time. A 2016 study derives a generalized employment rate that averages work intensity across all working-age individuals, where work intensity is total hours worked in a year divided by total hours worked in a full-time, full-year job [4]. As in inequality measurements, raising the weights to the power of a parameter, between 0 and 1, may capture different value judgments on the role of work intensity [5]. This generalized index yields the standard headcount employment rate when work intensity is not valued at all (a parameter value of 0) and the FTE employment rate when work intensity receives full weight (a parameter value of 1). However, for parameter values between 0 and 1, “redistributing” work from someone with high work intensity to someone with low work intensity raises the measured employment level (with the standard employment rate this only happens when hours are transferred to someone who is not working at all). In more intuitive terms, a country with 30% of the working-age population employed only 50% of the time and 30% employed full-time has a higher standard employment rate than a country with only 50% employed full-time (60% vs 50%, respectively), but has a lower FTE employment rate (45% vs 50%). The two countries would be judged to have the same employment level if people working only 50% of the time were assumed to be equivalent, in the social evaluation, to two-thirds of those working full-time: they would be valued less than one but more than one-half of a full-time employed person, where the excess of two-thirds over one-half (the relative work contribution in hours) is the extra value that the social evaluation attributes to having a job.
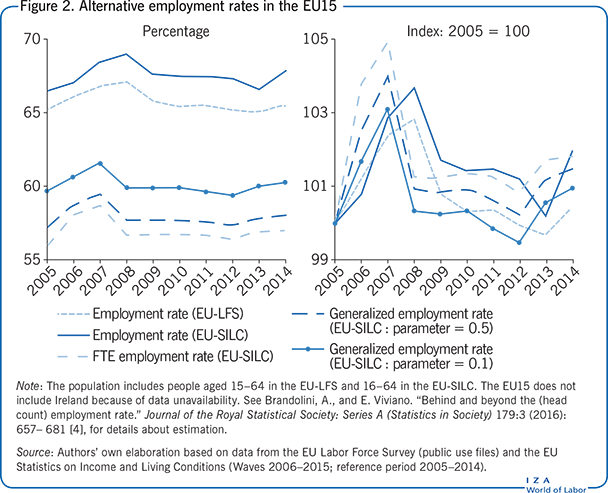
In the EU15 (excluding Ireland because of a lack of data) these alternative employment rates differ in levels and dynamics between 2005 and 2014 (see Figure 2). For reasons discussed in [4], the generalized employment rates are calculated from data drawn from the EU Statistics on Income and Living Conditions (EU-SILC). Due to differences in data sets and definitions, the official employment rate from the EU-LFS is consistently lower than the corresponding rate from the EU-SILC, but patterns are similar: a peak in 2008 is followed by a sharp fall in 2009 and then a steady decline until 2013. The FTE employment rate and the two other generalized employment rates exhibit much lower levels and different profiles: the turning point occurs in 2007, and the sharp fall in 2008 is followed by a flat, rather than moderately descending, trend. This might reflect in part the decline in hours worked per employed person during the Great Recession.
Weighting workers by their hours of work depicts something different from the picture revealed when looking at the standard employment rate. If policymakers care about hours of work per person, this suggests a reconsideration of the normative justification of targeting employment purely in terms of headcount measures. Relative to looking at employment rates and mean hours of work separately, the generalized employment rate is sensitive to the distribution of hours among workers and makes explicit the value judgment implicit in the measurement. Moreover, a continuous variable such as work intensity can be easily aggregated across individuals to derive household-level (non)employment indicators [4], which is a topic of growing policy concern, especially in relation to poverty and social exclusion [6].
The unemployed and other job-seekers
Official guidelines define the unemployed as people who have no occupation, are available to start work within the following two weeks, and have actively sought employment at some time during the previous four weeks. People who are neither employed nor unemployed are considered inactive and are excluded from the labor force. However, some inactive people have sought employment less recently, while others are not searching but would accept a job if offered one. Only certain segments of the inactive group show no attachment to the labor market, including full-time students, people engaged in home production (such as informal childcare or house work), and retired people.
Thus, lack of occupation and willingness to work are not sufficient to classify people as unemployed: it is also necessary that they prove that their joblessness is involuntary by actively looking for work in the recent period. The search step may take many forms—direct job application, contact with public or private employment agencies, action to start an own-account activity (own-account workers are those who, either on their own or with one or more partners, hold a self-employed job, and have not engaged any employees to work for them on a continuous basis during the reference period), placing, answering, or studying job advertisements, personal conversations with friends or relatives to find work—but it is a binding requirement. In the EU, 20.9 million people were unemployed in 2016; however, another 8.8 million people declared themselves to be available to work within two weeks but were classified as inactive because they had not been looking for a job in the four weeks before the interview. At the same time in the US, 7.8 million people were considered unemployed and a further 1.8 million people were classified as inactive, despite wanting and even searching for work during the prior 12 months, although not during the canonical four weeks.
The four week requirement permits a sharp separation of the unemployed from the inactive. Its rationale is to single out those who really want a job and hence are far more likely to find one. In reality, however, the boundary between unemployment and inactivity is blurred. Hiring rates depend not only on the number of unemployed, but also on the number of people who are classified outside the labor force but want, however feebly their actions may suggest, a job.
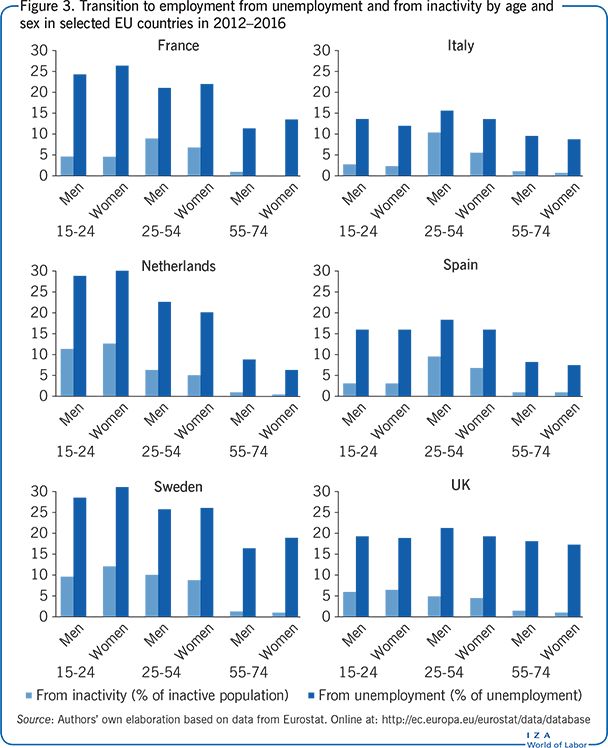
Eurostat’s longitudinal statistics about quarter-on-quarter transitions between labor market states show that the number of transitions from inactivity to employment is comparable to that from unemployment to employment. In 2012–2016, transitions to employment from inactivity totaled 41% of transitions from unemployment in Spain, 77% in France, and 100% in Sweden. Transitions from inactivity exceeded those from unemployment by 16–19% in the UK and the Netherlands, 48% in Italy, and 100% in Austria. As the size of the respective populations is very different (there are far more inactive people than unemployed), moving to paid employment is far more frequent, relatively speaking, from unemployment than inactivity: the share of those who started a job within a quarter ranged from 3% to 6% of inactive people versus 14% to 27% of the unemployed. Age patterns differ considerably across countries. For instance, in the Netherlands, people aged 15–24 show the highest chance of moving from inactivity to employment, suggesting a high prevalence of school-to-work transitions, while in Italy transitions among prime-age people (25–54) clearly dominate. Gender differences, on the other hand, are minor (see Figure 3).
Comparing transition probabilities between different states is a good way to evaluate labor market classifications [7]. By examining data for Canada and European countries, two studies identify a group of out-of-labor-force job-seekers whose transition probabilities are statistically distinct from those of the unemployed as well as other inactive people, suggesting that a classification into four states might be more appropriate than the standard tripartite classification [8], [9]. The second study also finds that these potentially active people form a diverse group, where some are virtually undistinguishable from the unemployed. The search intensity, as measured by the time since the last search action, that separates this subgroup from the rest of the potentially active people varies across socio-demographic classes: for men aged 35–64, for example, the cutoff is six months in the center-north of Italy, as opposed to 12 months in the south.
Hence, the official unemployment rate may be unsatisfactory both as a cyclical indicator of the tightness of the labor market—since many newly employed people come from outside the labor force—and as a measure of social exclusion—since many more people than the unemployed suffer from the penalties of unwanted joblessness. The evidence collected in the literature points to the arbitrariness of the four-week criterion. Yet, any other alternative time interval would be equally arbitrary.
Alternative measures of unemployment
A first way to overcome the limits of a rigid classification method is to adopt the dashboard approach, which calls for the elaboration of a set of (standardized) measures of non-employment to complement the official unemployment rate.
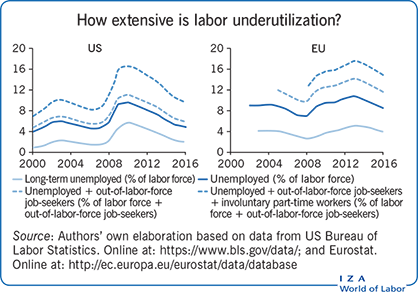
The US Bureau of Labor Statistics regularly publishes six “alternative measures of labor underutilization,” labeled U-1 to U-6. Two measures adopt narrower concepts than that underlying the official unemployment rate (U-3), either by focusing on the long-term unemployed only (U-1) or by excluding the unemployed who are new entrants or re-entrants into labor force (U-2). The other three measures take instead an increasingly broader notion of unemployment: first, by including “discouraged workers,” i.e. people who are not actively searching because they think that no work is available or they lack the characteristics required by employers (U-4); second, by further including all remaining out-of-labor-force job-seekers (U-5); finally, by also counting involuntary part-time workers, i.e. those employed part-time who want and are available to work full-time (U-6). Eurostat releases three “supplementary indicators to unemployment”: underemployed part-time workers (all people working part-time who wish to work additional hours and are available to do so), people seeking work but not immediately available to start, and people available to work but not actively seeking it. These definitions are roughly comparable, although the length of time defining long-term unemployment is 15 weeks in the US and 12 months in the EU.
In both the US and the EU, these alternative statistics exhibit fairly similar patterns over time, but indicate very different levels of labor underutilization (see the Illustration). This clearly matters when assessing the degree of labor market slackness, as emphasized by the European Central Bank’s Economic Bulletin of March 2017. Moreover, the multiplicity of indicators may be confusing in public debate. An alternative approach to deal with the variety of labor market conditions is to construct a synthetic weighted index. While this retains the effectiveness of a single number, it also suffers from complexity and disagreement about proper weights. Weights can be constructed to measure the potentially underutilized labor force or the total welfare loss due to joblessness.
The first option is offered by indices that cover all potentially employable people but weight them according to the probability of finding a job from their current labor market state. An early example is the weighted measure of non-employment discussed in the Bank of England’s Inflation Report of August 1999, whereas a more recent one is the non-employment index estimated for the US in a 2014 study [10]. Both indices calculate the weighted sum of the population shares of unemployed and inactive people, using employment transition rates as weights. The US non-employment index fluctuates less over the business cycle than other measures of labor underutilization. While it does not suggest a different reading of the economic cycle, it does signal weaker improvement since 2010 than other indicators.
The second example is provided by indices that differentiate the unemployed by unemployment duration. The longer unemployment spells are, the lower the probability of re-employment, the higher the depreciation of human capital, and the heavier the loss in individual welfare. The standard unemployment rate computes the proportion of unemployed in the total labor force at a certain time, regardless of the time spent in unemployment. Based on normative criteria, a study published in 2009 derives instead an index that accounts for welfare loss due to unemployment duration [11]. When policymakers have no concern for duration, all unemployed people are equally weighted and the index coincides with the standard unemployment rate. When individuals are weighted according to the duration of unemployment, the index reflects the average unemployment duration across the whole labor force and signals that labor market conditions may worsen when people remain unemployed for longer periods, even if the unemployment rate is unchanged. As before, it is possible to account for a less extreme societal aversion to unemployment duration by raising the weight assigned to each individual according to a parameter that measures the importance of experiencing longer unemployment spells. For certain parameter values, the index reflects how the total time spent in unemployment is distributed among the unemployed: it rises not only with the share of unemployed in the labor force and the mean length of their unemployment spells, but also with the extent to which unemployment experiences are unequally shared.
Limitations and gaps
Neatly defined indicators such as unemployment and employment rates have the great advantage that they can be clearly and simply communicated. This is achieved, however, at the cost of ignoring multiple facets of labor markets. A richer statistical representation can be attained by either adopting a dashboard of indicators or by elaborating a synthetic index that condenses alternative situations into a single number through appropriate weighting. The first solution makes no attempt to reduce diversity: it is less demanding in terms of conceptual structure and measurement requirements, but it is difficult to draw a well-defined unitary picture. The second solution has the advantage of summarizing a multifaceted reality into a single value, which is simpler to communicate and more easily captures the attention of policymakers and the general public; the downsides are the computational complexity and the arbitrariness of the weighting structure.
Despite their potential relevance for monitoring labor markets, the development of experience-weighted measures is hampered by data availability, as LFSs typically collect information on current conditions along with some recall information about past events. This problem is well-known in studies of unemployment duration, which rely on statistical techniques to derive the length of completed spells from the available data on ongoing unemployment spells [12]. The information on all employment spells during a period (e.g. a year) is equally missing in LFSs. To estimate work intensity, the above-mentioned 2016 study relies on the EU-SILC. These problems could be overcome by using administrative archives, provided that they cover the whole working-age population.
Finally, this article focuses on stock measures but the reference to transition probabilities among labor market states underlines the importance of also considering flow measures (see, e.g. [13]).
Summary and policy advice
The work of statistical agencies, international organizations, and academic researchers has led to the consolidation of a set of standardized labor statistics. These statistics serve multiple analytical purposes, as they are used to measure labor slackness, aggregate labor potential, social exclusion, or discrimination. At the same time, societies change. Aging means that the bounds of the working-age population may need to be shifted upwards, following increases in schooling years and life expectancy. The “unbundling” of productive tasks and the development of the gig economy mean that people may engage in multiple paid activities (e.g. renting out their apartments, driving their cars as taxis) while they search for a traditional job, confounding the traditional classification of employment and unemployment.
All this suggests re-examining the existing set of labor statistics. This article has stressed three issues. First, a broadening of the battery of indicators may overcome the limits of the strict tripartite classification of labor market states, allowing for a more nuanced description. Second, experience-weighted measures could summarize into a single number the diversity of labor market conditions that people experience (e.g. the duration of joblessness for the unemployed or working hours for the employed). Third, it must be borne in mind that well-defined, if unnoticed, normative judgments underlie employment and unemployment measures; this awareness is especially relevant when these statistics become policy targets.
Acknowledgments
The authors thank two anonymous referees and the IZA World of Labor editors for many helpful suggestions on earlier drafts. They also thank Alfonso Rosolia. Previous work of the authors contains a larger number of background references for the material presented here and has been used intensively in all major parts of this article [4], [9]. The analysis and conclusions expressed in this article are those of the authors and not necessarily those of the Bank of Italy or the Eurosystem.
Competing interests
The IZA World of Labor project is committed to the IZA Guiding Principles of Research Integrity. The author declares to have observed these principles.
© Andrea Brandolini and Eliana Viviano