Elevator pitch
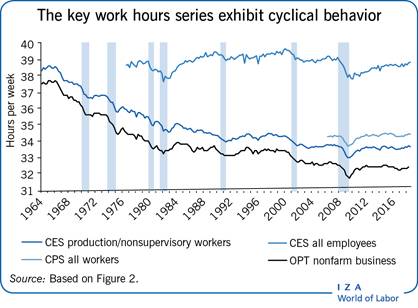
Work hours are key components in estimating productivity growth and hourly wages as well as being a useful cyclical indicator in their own right, so measuring them correctly is important. The US Bureau of Labor Statistics (BLS) collects data on work hours in several surveys and publishes four widely used series that measure average weekly hours. The series tell different stories about average weekly hours and trends in those hours but qualitatively similar stories about the cyclical behavior of work hours. The research summarized here explains the differences in levels, but only some of the differences in trends.

Key findings
Pros
On average, respondents to the US BLS's household survey correctly report weekly hours worked per person and weekly hours worked on their main jobs.
All series exhibit similar cyclical behavior.
Differences in levels between the longest-running series (Current Population Survey (CPS), Current Employment Statistics (CES) production and nonsupervisory workers, and Office of Productivity and Technology (OPT )) can be explained by differences in concepts and coverage.
These three series exhibit similar trends since the beginning of the 1990s (all four since 2007).
Hours measured in different countries’ labor force surveys can be compared after adjusting for differences in survey reference periods.
Cons
Significant differences exist between the longest-running series in levels and trends; differences in long-term trends cannot be completely reconciled.
In the household survey, respondents under-report multiple jobholding and over-report hours worked on second jobs; still, aggregate hours are approximately correct because these errors mostly offset each other.
Estimating annual work hours from average weekly hours overstates the annual number of hours worked, since the surveys’ reference periods exclude most holidays.
Hours worked as recorded in national income accounts across different countries are difficult to compare because of differences in data sources.