Elevator pitch
Labor market responses to temporary aggregate demand shocks are commonly analyzed and discussed in terms of changes in employment and unemployment. However, it can be seriously misleading to ignore the interrelated behavior of hours worked. Work hours can be altered relatively speedily and flexibly, and this strongly relates to employment, labor productivity, and unemployment outcomes. The hours–employment distinction is especially important in the evaluation of the performances of European labor markets during the negative shock experienced during the Great Recession.
Key findings
Pros
Short-term costs of adjusting employment are relatively high, so changes in hours enable national economies to react more speedily to unexpected aggregate demand shocks.
Different rates of adjustment of employment and hours worked have important implications for measuring the labor productivity effects of demand shocks.
Unemployment rates understate the full impact of negative demand shocks since, on average, employees are underemployed due to a positive gap between their desired and actual working hours.
Cons
Not all hours worked offer demand-response flexibility, e.g. when an employee’s required standard working hours do not include opportunities to deviate from prescribed daily/weekly schedules.
Since measured hours typically fail to take changes in hourly effort into account, they may inadequately represent the adjustment of working time to demand shocks.
If actual paid-for hours fall short of desired hours, effects on workers’ morale may adversely impact work application and effort.
Author's main message
Aggregate labor demand shocks serve temporarily to increase or decrease the demand for goods and services. From a labor market perspective, shocks necessitate speedy revisions of required employment and hours inputs in order to circumvent costly over- or under-supply of output. In their adjustments to shocks, many firms make use of short-term working time flexibility. Evidence from the 2007 negative shock that gave rise to the Great Recession indicates that policymakers should be cautious about imposing excessive restrictions on employers’ ability to vary working hours as doing so may exacerbate adverse labor market repercussions.
Motivation
The Great Recession was initiated in 2007 by the US subprime mortgage crisis and spread with varying degrees of severity to other national markets, especially those with large financial sectors. Subsequent adverse effects on macroeconomic performance included reductions in bank lending, falls in consumer and business confidence, lower exports volume as the recession spread globally, and increased fiscal austerity by governments. Associated labor market repercussions included falls in labor productivity, rises in unemployment, and shorter working hours. In particular, comparing German, UK, and US employment and working time reactions to the Great Recession provides potentially important clues in respect of improvingthe efficacy of policy responses to future crises.
Discussion of pros and cons
Figure 1 illustrates possible, and perhaps typical, demands for average working hours and employment given unexpected positive or negative temporary demand shocks. At a specific point in time, the employment input is referred to as the employment stock while average hours input is its rate of utilization (e.g. over a working day). For the present, capital is treated as a fixed factor of production. The general objective is to meet given output demand at minimum labor cost. Output changes are assumed to be exogenous, that is, they are due to external influences.
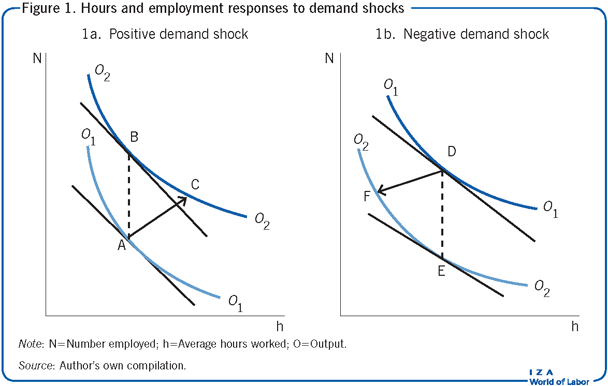
The output curves represent isoquants or equal product curves. In Figure 1, the curve O₁ shows all combinations of employment and average hours that produce this level of output. The curve O₂ shows combinations that produce a higher level of output. Below or tangent to output curve O₁ is a straight line.This is a so-called isocost line; it represents all combinations of employment and average hours that can be purchased at a given total labor cost. The slope of an isocost is determined by the relative costs of hours and employment. (Changes in relative costs would alter the slope of the isocost line but, for simplicity, this possibility is ruled out here.) The tangency point A shows the minimum hours–employment cost combination that produces O₁.
Suppose there is an unexpected temporary rise in output demand, represented as a shift from curve O₁ to curve O₂. The new cost minimization point is B, representing the lowest hours–employment cost that produces this new output level. The expansion path A–B provides the least-cost route of moving from A to B. In reality, however, this route cannot be taken as there are relatively high transaction costs of employing new workers which result in impediments to speedy adjustments of employment. These include the time and money costs of searching for, hiring, and training new recruits. Moreover, employers may be cautious over the pace of workforce expansion as they initially try to form expectations of the strength and longevity of the improved business conditions. Adjusting working hours will also involve transaction costs, such as finding existing employees who are willing to extend their hours of work, but these are likely to be significantly lower. So how can the new output demand be met in the short term? It may be achieved by taking route A–C–B. In the initial stages, point C on O₂ will be reached primarily through rapid increases in hours of work that overshoot their eventual equilibrium at point B. Labor inputs would then be gradually adjusted between C and B through incremental increases in employment and reductions in working hours. In the short term, total labor costs of producing O₂ between C and B will be above their minimum level.
Comparing the long-term cost-minimizing start and end points A and B, it can be seen that employment increases while average hours adjust back to their original starting value. This long-term constancy of hours is referred to as “scale invariance.” It is in fact a property of a wide class of production models adopted by economists, the most popular of which is the Cobb-Douglas production function [1]. In practice, it is unlikely to be observed precisely, but there is (as will be reported below) reasonably strong empirical support for treating it as a good approximation of what takes place.
The equivalent scenario for a temporary negative demand shock is illustrated in Figure 1. Starting at cost minimization point D, output demand unexpectedly falls from O₁ to O₂. Again, sluggish employment adjustment is likely to rule out moving along the least-cost expansion path D–E. First, employers may well be reluctant to incur the transaction costs of statutory and/or company-level redundancy payments until the likely severity of the downturn has been fully evaluated. Second, uncertainty over the length and depth of the fall-off in output demand could make companies hesitant about losing human capital investments in the specific skills and know-how of their existing employees. In the short term, this uncertainty will lead to retention of higher stocks of employment than eventually required, thereby causing workers’ productivity to fall. However, a proportion of the associated costs may be offset through short-term reductions in working hours. This might be achieved by reducing overtime hours, introducing short-time working arrangements, or replacing some full-time jobs with part-time jobs. So, a likely adjustment route is D–F–E. Rapid short-term cuts in hours help to accommodate the lower output demand despite sluggish falls in employment. Longer-term adjustments from F to E, with total labor costs above their minimum, will consist of continued reductions in employment, and a rises in working hours to regain their long-term least-cost equilibrium.
From an empirical standpoint, estimation of the demands for hours and employment would not only involve measuring changes in current output and in the relative prices of these two factor inputs but also the own-adjustment speeds of hours and employment and how they respond to oneanother’s disequilibrium when forced off their least-cost expansion paths.
The stock and utilization of capital
So far the focus has been on two factors of production, hours and employment. While these variables are of principal concern, the interactive role of capital cannot be ignored. Labor and capital combine to produce output, and their various combinations cause production to become more or less labor intensive. As with labor, the measure of capital should be separated into a stock dimension and a utilization dimension. Examples of capital stock at a given time include machine tools, tractors, computers, and workplace buildings, and their rate of utilization refers to the intensity of machine use (etc.) per period of time.
Whilst most empirical studies of production include a measure of capital stock alongside labor variables, it is not so common to include the capital utilization dimension. This leads to a problem in the current context. Consider measuring the short-term relative productivities of factors of production, which can be achieved directly through estimating production functions. In general terms, production is modeled such that output is produced by combining stocks and utilization rates of labor and capital. It has been established that omitting capital utilization produces inflated estimates of the short-term productivity of hours; that is, the change in output for an incremental change in working hours [2]. Why is this? If average daily hours in a manufacturing plant are extended by increasing overtime, this will necessarily involve a more intensive daily use of capital equipment. In the absence of measuring the productivity implications of this increased machine use, overtime would act as a proxy measure for the productivity changes resulting from both working hours and capital utilization. Thus, in order to capture short-term output effects of changes in working hours in their own right, a measure of capital utilization needs to be incorporated into the analysis.
Measuring capital utilization is potentially difficult, however. Economists typically use capacity utilization as a proxy measure. This shows the extent to which installed productive capacity in a firm/industry/nation is actually being realized at a point in time. It is most commonly measured in terms of actual output expressed as a percentage of potential output. An economy operating significantly below its full potential will be able to expand production relatively speedily without incurring substantial time and monetary costs of acquiring new capital equipment and buildings.
Interrelated factor demand
Two economists, Ishag Nadiri and Sherwin Rosen, provide the seminal factor demand analysis. It incorporates the notions of long-term cost-minimizing equilibrium and short-term disequilibrium among the four factors: employment, average hours, capital stock, and capital utilization [3]. This does not lend itself to two-dimensional illustrations, but the underlying logic is the same as in Figure 1. Long-term equilibrium occurs at points where combined labor and capital costs are minimized at a given output requirement. Disequilibrium paths are modeled by allowing deviations between desired and actual factor adjustment paths. Each of the four factor demands is functionally related to current output, relative factor prices (i.e. for labor and capital), and to the own-adjustment speed of each factor as well as its reaction to the short-term disequilibrium of the other three factors. The authors use quarterly data for US total manufacturing during the post-war growth period between 1947 and 1962. There is a wealth of findings, four sets of which are especially relevant to the present discussion.
The factor demand responses to a once-and-for-all unit change in output are investigated. This is conceptually similar to the positive output demand shock shown in Figure 1. The authors find immediate and strong increases in hours and capacity utilization (i.e. the proxy for capital utilization). Both rates overshoot their ultimate long-term equilibrium values. The response of employment is slower, although it too, over a slightly longer period, overshoots its long-term value. In contrast, the movement of capital stock is extremely sluggish. In essence, the story is one of short-term adjustments in hours, capacity utilization, and, to a lesser extent, employment to achieve the new higher output level, thereby allowing time for capital stock to adjust at its much slower rate.
Omitting capacity utilization from the analysis serves to produce unrealistically high short-term labor returns.
In the long term, after allowing for short-term factor adjustments, hours are found to be statistically scale-invariant while long-term changes in capacity utilization are very small.
The ratio of wage to capital costs appears in the employment and capital stock demand specifications; it would be expected to be negatively related to employment and positively to capital stock. For example, a rise in labor costs relative to capital costs would make it more cost-effective to substitute more capital stock for less employment. (Actually, the authors’ estimates do not fully support expected substitution effects.)
Against the background of this conceptual framework, the behavior of hours and employment during the most significant post-war negative demand shock, the so-called Great Recession, will be examined next.
Hours and employment in the Great Recession: The UK, Germany, and the US
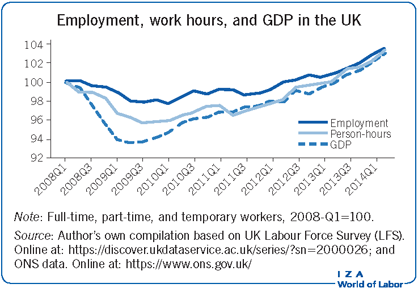
The Illustration shows the movements of employment, person-hours (numbers employed multiplied by average hours), and real gross domestic product (GDP) in the UK during the Great Recession. Figure 2 shows the associated peak-to-trough percentage changes for these measures during the recession in the UK, Germany, and the US. The UK shock was very severe, with real peak-to-trough GDP falling by 6.3%. Employment fell by a relatively modest 2.3%, while person-hours changed more in line with GDP, with a 4.3% drop. The 6.6% fall in German GDP matched that of the UK. Germany’s fall in employment was a trivial 0.5%, while that of person-hours was a much larger 3.4%. Compared to these EU countries, the 4.1% GDP decline in the US was not quite as severe, while its employment and person-hours reductions were considerably greater, at 5.6% and 7.6%, respectively. As found in [3], the change in US employment was not too dissimilar from that of hours. All of these relative outcomes are consistent with the short-term scenario depicted in Figure 1.
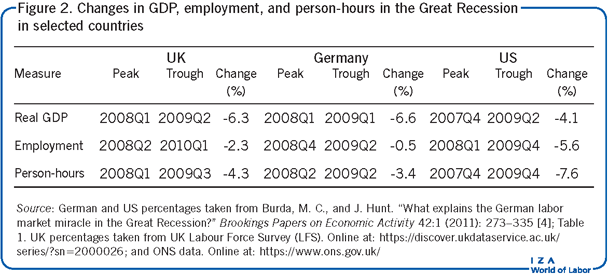
The three countries in Figure 2 experienced a fall from peak person-hours that preceded that of employment by at least onequarter. From the UK Illustration, the initial hours’ fall-off was especially steep, falling by 1.1% in the first quarter. A similar starting pattern of hours is reported for Germany [4] and the US [5]. Both the lead-timing and initial strength of the hours’ responses are consistent with the findings [3].
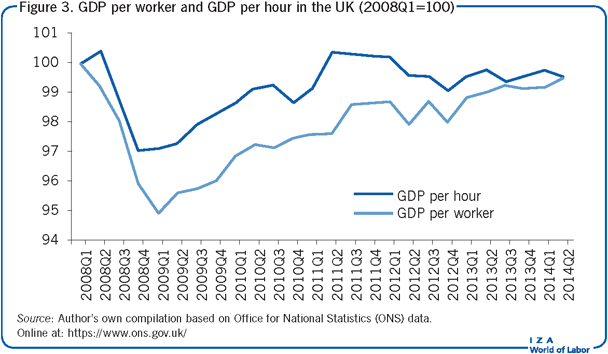
Marked declines in labor productivity have been a common feature of EU economies during the Great Recession. Figure 2 shows far greater UK and German peak-to-trough percentage falls in GDP compared to employment. This translates into large reductions in productivity, measured as GDP per worker. But falls in person-hours exceeded those of employment. On average, workers worked fewer per-period hours. Hence, productivity falls measured as GDP per hour were less than those measured as GDP per worker. Figure 3 illustrates this for the UK. Over the initial strong dip in productivity between 2008Q1 and 2009Q1, GDP per worker fell by 5% and GDP per hour by 3%. The former remained below the latter until mid-2014, and thereafter (not shown on the graph) remained pretty much equal until the end of 2015. In fact, the UK pattern of GDP per hour is reasonably in line with Germany, France, and Italy between 2008 and 2012, in contrast to the relatively strong productivity growth seen in the US from 2009 [6]. The superior US productivity performance followed its much stronger propensity to reduce the sizes of both employment and person-hours.
What accounted for the mild employment responses in the UK and Germany?
The US short-term response to the advent of the recession was to reduce employment levels, and increase unemployment, more or less commensurately with the drop in demand. In contrast, there were relatively mild employment responses in the UK and, especially, in Germany. What accounted for these employment reactions?Two major contending explanations are (i) wage moderation and (ii) labor hoarding.
Real-wage moderation has been a feature of the UK economy from 2008 to the present. Its associated negative effect on firms’ labor costs probably provides a principal reason behind the lack of major employment changes in this period. Between 2008 and 2012, UK real wages fell by more than all other G7 countries [7]. Between 2010Q2 and 2013Q2, average weekly earnings fell by an annual average of 1.6% [8]. As reported earlier, a fall in the ratio of wage-to-capital costs is likely to be associated with the substitution of employment for capital. The ratio did fall significantly in the UK during the recession, both with respect to declining wages and rises in the cost of capital [6].
Beyond wage moderation, there are at least three reasons to suggest that labor hoarding also played a role in the UK’s modest employment reduction during the recession [7]. First, at the start of the recession firms were reasonably financially secure, and so faced relatively little pressure to downsize their workforces. Second, firm-specific skills were higher than in previous recessions, thereby lending more encouragement to limit skill-losses. Third, the recession was marked by significantly higher cooperation between workers and management over the means of preserving existing jobs.
Wage moderation is unlikely to have played a significant role in explaining German firms’ lack of employment response. As in the UK, German real wages exhibited great flexibility in the decades leading up to the Great Recession, but, unlike the UK, they showed no strong decline during the recession itself [9]. But two labor hoarding arguments have been advanced [4]. First, due to risk aversion, German employers did not expand their workforces to a degree commensurate with the strength of economic growth in the period leading up to the recession. As such, there was less need to shed surplus workers when the recession struck. Second, due to the prevalence of individual working time accounts, German employers avoided particularly large hours-related layoff payments by holding on to their existing employees. At the start of the recession workers held unusually large surplus hours’ accruals in their accounts; these were hours worked above those collectively agreed during the previous growth period. Normally, such surpluses are paid-off in subsequent economic downturns through compensating cuts in working time. If this is not achieved because workers are laid-off, surplus hours at the time of separation have to be compensated at overtime premium rates. It should be added, however, that several prominent labor economists have cast doubt on the strengths of these two hoarding arguments [4].
Underemployment vs unemployment
At the start of 2009, UK and German unemployment rates peaked at about 8%, while the US rate was approaching its end-of-year peak of 10%. These percentages represent excess supplies of workers. However, if one were to measure excess supply in terms of person-hours rather than persons, the unemployment rate in all three countries would look even worse.
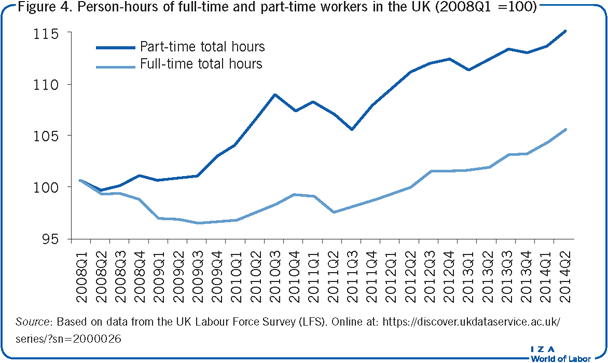
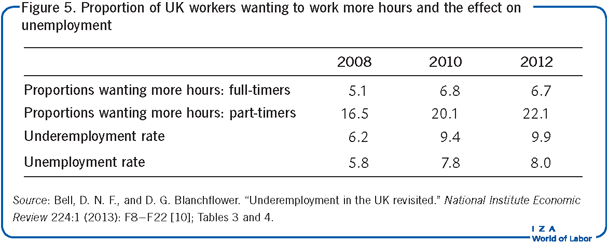
A major contributor to the fall in the UK’s person-hours during the Great Recession was a growing incidence of part-time relative to full-time employment. The percentage of full-time to total employees (full-time plus part-time) fell from an average of 74.5% from January 2000 to December 2008 to 73% from January 2009 to November 2013 [9]. Figure 4 illustrates the relative changes over the recession in terms of person-hours of full-time and part-time workers. Unsurprisingly, the actual number of hours worked by many part-time workers was less than their desired hours. As shown in Figure 5, 20% of part-time workers desired more hours in 2010, as did 7% of full-time workers.
During the UK recession, there was a net shortfall in actual compared to desired working hours among workers in employment.Essentially, this translates into underemployed hours.Conventionally, unemployment is measured only in respect of wholly unemployed workers.So adding underemployed hours of workers in employment tothe estimated hours that would have been supplied by wholly unemployed workers would serve to increase conventional measures.
Converting the UK’s unemployment rate into its hours-equivalent (assuming each unemployed worker were to work average work hours) and adding this to the net additional hours desired by employed workers produces a more general underemployment index [10]. Figure 5 reports the difference between this general index (the underemployment rate) and the comparable hours-index for wholly unemployed workers (the unemployment rate). The two rates were closely matched from 2001 to the end of 2007, and then began to diverge in 2008 and had increased substantially by 2010.
There is an important caveat. If UK working time had exhibited significantly greater downward rigidity, then more workers are likely to have been laid-off during the recessionary years. For many this would have been deemed a considerably worse outcome compared to a shortfall in actual compared to desired hours of work.
Limitations and gaps
It is clear from the macro evidence presented here that many firms react relatively speedily and forcibly to demand shocks by changing their number of person-hours.However, such flexibility is ruled out in firms with fixed weekly and daily work schedules that apply to most of their workers and that do not afford the opportunity for overtime or part-time work or other non-standard hours. While in many cases this will be necessitated by the nature of the production or service provision, there may yet be considerable scope for workers and employers to introduce working time practices that are more attuned to economic fluctuations.
Firms may set wages above market rates. Their objectives include encouraging longer average employment tenure (reducing turnover costs), motivating worker good will (manifested through improved work application and effort), and discouraging work shirking (through increasing the wagepenalty of being caught and fired). An underlying profit motive is to increase revenue through enhanced labor productivity that exceeds the cost of paying higher wage rates. Relatively strong incentives in these directions are likely to occur during periods of high and growing product demand coupled with tightening labor markets that offer abundant job opportunities to able workers.Moreover, employers know that the length of working time itself can directly influence productivity, for example, through effects on workers’ physical fatigue and powers of concentration as the working day lengthens. They may, therefore, set both hours and wages differently from standard norms with an eye on optimizing labor efficiency. The effects of such dual wages and working time determinations in so-called efficiency wage-hours models lead to more complex influences on labor productivity [11]. The general point, however, is that the role of person-hours may need to be modified if working time is measured in efficiency units rather than simple time units.
Research on the distinction between unemployment and underemployment clearly uncovers the unsurprising fact that during periods of negative demand shocks many employees are required to work actual hours that are fewerthan their desired hours. This has implications not only for the proper measurement of excess labor supply, but also for workers’ job attitudes. The extent to which job satisfaction is adversely affected in this way may negatively impact work performance. Again, the efficiency of working hours would seem to provide a potentially important extension.
Summary and policy advice
Differentiating between hours and employment responses to demand shocks has three principal implications. The recent negative demand shock serves to illustrate these.
First, short-term economic adjustments are more speedily accommodated through person-hours changes rather than by employment changes alone. Second, productivity per person differs from productivity per hour. And third, the measure of excess labor supply is altered if extended to include not only workers wholly unemployed but also employed workers who cannot work their desired hours.
The relative flexibility of person-hours compared with employment in the face of demand shocks is clearly associated with important benefits and costs. They help firms to respond to unanticipated shifts in demandmore speedily. During economic downturns, adjusting person-hours contributes to wage-earnings losses among workers whose actual hours of work fall short of their desired hours. However, the costs of not achieving output requirements in a relatively speedy manner—associated with shortfalls or excesses in the production of goods and services—are likely to be considerably greater. As such, the response patterns of hours compared to employment during demand shocks provide substantial net benefits. Policymakers need to be cautious about imposing excessive constraints on the flexibility of working time.
Acknowledgments
The author thanks the IZA World of Labor editors forsuggestions on earlier drafts.Olaf Hübler provided a number of very helpful comments.
Competing interests
The IZA World of Labor project is committed to the IZA Guiding Principles of Research Integrity. The author declares to have observed these principles.
© Robert A. Hart