Elevator pitch
Imagine a government confronted with a controversial policy question, like whether it should cut the level of unemployment benefits. Will social welfare rise as a result? Will some groups be winners and other groups be losers? Will the welfare gap between the employed and unemployed increase? “Happiness data” offer a new way to make these kinds of evaluations. These data allow us to track the well-being of the whole population, and also sub-groups like the employed and unemployed people, and correlate the results with relevant policy changes.
Key findings
Pros
By measuring the welfare effects of a policy change directly, “happiness data” may lessen reliance on theories; they can capture all of the costs and benefits of a policy that otherwise may be hard to determine and aggregate.
“Happiness data” can provide estimates of the welfare effects of a policy on different sub-groups.
“Happiness data” may offer a better way to estimate costs and benefits than “willingness-to-pay” surveys that are notoriously unreliable.
Cons
It is difficult to determine the best questions to pose to measure well-being accurately.
It is unclear whether people’s happiness scores can be compared as different groups may self-report the same level of well-being differently.
There is uncertainty over the short- versus long-term impact of shocks on happiness and some studies show strong adaptation to income.
Author's main message
Estimating the welfare effects of a new policy, like a cut in unemployment benefits, is difficult. Economists lack dependable methods to measure all of the costs and benefits of potential policy changes. As a result, politicians often end up relying on their own discretion when making key decisions. “Happiness data” can be used to measure the overall welfare effect of a change in benefits directly, considering whole populations as well as relevant sub-groups. This provides additional, comprehensive data that can be used when evaluating potential policy options.
Motivation
Has the European welfare state become too generous, essentially undermining incentives to work? Supporters of this view argue that life on benefits has become almost as good as working life for many people in Europe, thereby driving up unemployment rates. They base their evidence on studies that show a positive relationship between unemployment and benefit levels, and consequently argue in favor of cutting welfare benefits.
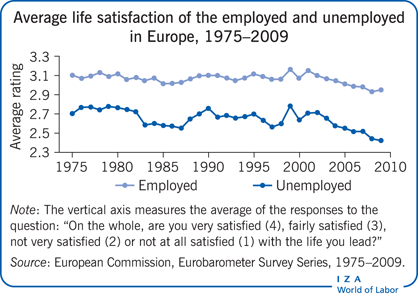
Is there other evidence that can be brought to bear on this important policy question? An alternative approach is to measure the self-reported well-being, or “happiness,” of the employed and the unemployed. The Illustration plots the happiness of these two groups for nearly four decades. The “happiness gap” does not appear to have changed much, suggesting that the welfare state has not, in reality, made unemployment a more attractive proposition in relation to employment. This new kind of evidence will not, of course, end the debate on the size of the welfare state in Europe, but it does suggest that “happiness data” may help throw light on some important policy questions.
Discussion of pros and cons
How will an economic policy change affect social welfare? Should politicians rely on their own discretion to make this kind of judgment? If a politician instead decides to rely on the advice of an expert, how would he or she try to measure the impact? The government’s treasury would probably want to get some estimates of the costs and benefits related to the proposed policy. To do so, they would first have to know how a policy change is expected to affect people’s behavior. But economists may disagree on the behavioral effects. Even when agreement does exist on how behavior would be affected, the impact on people’s welfare still needs to be determined through a theoretical model. However, different models may give different predictions.
We discuss examples of specific policy questions that governments often ask economists for help with the estimation of welfare effects. We first consider the traditional approach, namely cost–benefit analysis, before asking whether there is a role for happiness data within the evaluation process. Three examples are given of how happiness data can help policymakers. The first example is about valuing environmental costs and benefits, whereas the second concerns a controversial debate about whether cigarette taxes should be increased. Our third, and main example, is centered on the labor market question concerning how generous unemployment benefits should be. We conclude by discussing the issue of how to decide, among the many different measures of well-being, which one is the best to choose for policy purposes.
Happiness data as a policy making metric
The use of well-being (or happiness) data to evaluate economic policies is still limited, but subjective data of a different kind have already been extensively used to help inform cost–benefit analysis. Contingent valuation surveys (or “willingness-to-pay” surveys), where people are asked questions like “What is the most you would be willing to pay each year through higher taxes, prices, or user fees to improve environmental services?” are regularly used to help value public goods in monetary terms. However this approach has been much criticized for giving inaccurate valuations. There can be strategic manipulation of the answers in these kinds of surveys and a lot depends on the subject’s ability to understand difficult issues related to the state of the environment and the workings of the economy. Prior research has cast doubt on the numbers obtained from contingent valuation surveys, like the $32 billion per year set aside for the preservation of the whooping crane, arguing that these kinds of numbers are more expressions of attitude, rather than indications of economic value [1]. An advantage of happiness data is that they require only a minimum of information processing and understanding; instead they rely only on introspection of one’s personal level of well-being.
The first example of how happiness data can help answer a policy question concerns the valuation of a public good, like air quality. To overcome the problems of willingness-to-pay surveys, a person’s level of happiness can be measured and correlated with, for example, the level of pollutants in the area where they live and with their income. This allows one to calculate the amount of income needed to compensate a person for lower environmental quality. An estimate obtained this way suggests that an increase in sulfur dioxide emissions of 1 μg/m3 makes people feel worse off by an amount equivalent to a 1.5% decline in their household income. These kinds of estimates shows policymakers how significantly pollution affects people’s welfare [2].
A second example of how happiness data can be used to help solve a policy question and help overcome some of the problems associated with traditional cost–benefit analysis concerns a government considering whether to increase cigarette taxes. The government in question wants to know whether the welfare of smokers will rise or fall as a result of the new tax policy. Studies often estimate that cigarette purchases fall when prices rise. However, this behavioral effect is consistent with two different theoretical models that suggest opposite corresponding welfare effects. The “rational addiction” model predicts that the welfare of smokers will fall as the cigarettes that they enjoy become more expensive (i.e. their happiness declines because they are unable to afford to smoke as often as before). However the “psychological/self-control problem” model predicts that cigarette taxes raise the welfare of smokers by providing them with a commitment device [3]. In this instance, a higher tax may result in a happier smoker by helping him or her to quit. How can one resolve these ambiguous welfare predictions coming from the models? One way is to measure the welfare of smokers directly by asking them about an emotion they are currently feeling. Their responses can then be correlated with changes in the level of cigarette taxes to determine a relationship between the two.
The US General Social Survey has a question that asks: “Taken all together, how would you say things are these days—would you say that you are very happy, pretty happy, or not too happy?” These happiness data are available for both smokers and non-smokers, and can be correlated with cigarette tax data from the US states. Cigarette tax changes should affect the happiness of smokers, though they may also affect non-smokers to the extent that they experience external effects from smoke. It turns out that higher taxes do, on average, increase smokers’ well-being, compared to non-smokers, presumably by helping them give up. Consequently, the evidence from happiness surveys favors the self-control problem model and is inconsistent with the rational addiction model. In other words, these surveys can inform us as to which theory of smoking is correct. To summarize, the use of a simple happiness metric to evaluate welfare effects directly can help policymakers avoid the need to predict by how much changes in cigarette taxes will affect smoking behavior and can also help them avoid the theoretical debates about why people smoke.
Aside from valuing the environment and cigarette taxes, happiness data may also be used to evaluate labor market policies. For example, the extent to which the unemployed should be helped by the government depends a lot on whether unemployment is voluntary or involuntary. Some economists take the view that jobless people are voluntarily choosing not to have a job since they do not find work attractive enough. If so, unemployment may not be seen as a significant problem, with the consequence that policymakers may wish to reduce the attractiveness of being out of work by cutting benefits. However happiness data have revealed that the unemployed are much less happy than those who work. Becoming unemployed has a more pronounced negative effect than divorce, according to the data [4]. Drawing on this result, some economists have argued that labor market policy should be skewed toward providing a comprehensive social safety net [5].
Using happiness data to evaluate unemployment benefit levels
How can happiness data help inform a government that is facing the question of whether to cut unemployment benefit generosity? Economists have found evidence suggesting that if benefits are reduced then the unemployment rate may fall. However, like the smoking example above, the welfare effects are uncertain. There are conflicting forces arguing both sides of this issue. For example, if one assumes that unemployment will decline as a result of benefit cuts, then it stands to reason that the unemployed may find it easier to get a job, thereby leaving them happier. On the other hand, those who are still unable to find work may suffer due to a drop in their benefits, thereby becoming more miserable. In addition, there may be “social contagion” effects, whereby the families of unemployed workers could be affected by a cut in their benefits. For example, having a depressed unemployed person in the household may cause others in the family to also experience more negative emotions [6]. As for those people who are employed, they also face a mix of conflicting effects. On the positive side, they may expect to spend less time out of work in the event that they should lose their job in the future, due to the expected reduction in overall unemployment related to benefit cuts. Their taxes may also be reduced when benefits are cut. On the other hand, their happiness levels may drop, since the risk of becoming unemployed in the face of less generous benefits now involves a greater personal cost.
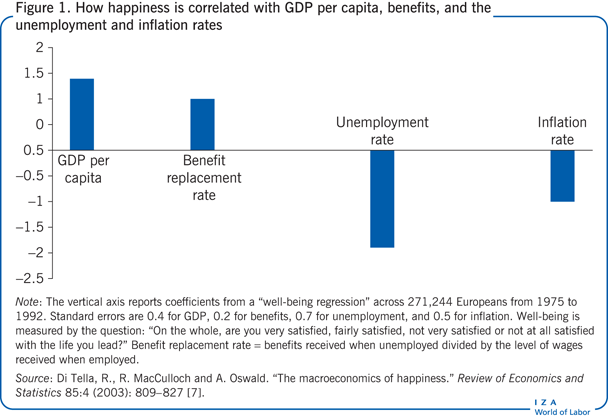
Trying to quantify each of these possible consequences to determine an aggregate welfare effect is extremely difficult. To help resolve this problem, direct measures of people’s well-being can be used. For example, an EU survey series asks: “On the whole, are you very satisfied, fairly satisfied, not very satisfied or not at all satisfied with the life you lead?” The answers can be correlated with macroeconomic variables like benefit generosity, GDP per capita, the unemployment rate, and the inflation rate. Figure 1 reports results from this exercise. Accordingly, life satisfaction is positively correlated with GDP and the benefit replacement rate (i.e. benefits received when unemployed divided by the level of wages received when employed) and negatively correlated with unemployment and inflation. To overcome the problems with willingness-to-pay surveys, we can instead use our estimates of the correlations of life satisfaction with these macroeconomic variables to calculate the amount of income needed to compensate a person for living in a country with less generous benefits. The results suggest that a person who lives in the Republic of Ireland, where the replacement rate was 0.28 over the sample period, would need an extra $507 (US 2014 values) in compensation to experience the additional life satisfaction that comes from living in a country with a more generous welfare state, like France, where the replacement rate was 0.31. This number, however, does not take account of the need for higher taxes to fund more generous benefit levels [7].
It turns out that life satisfaction is also positively correlated with benefits and negatively correlated with the unemployment rate for each of the employed and unemployed sub-groups. The magnitude of the effect of benefits on the well-being of both groups is similar. Consequently, a cut in benefits may be expected to hurt those who stay jobless, unless any fall in the unemployment rate is enough to compensate them by shortening the duration of their unemployment. The employed are predicted to suffer by a similar amount from a cut in benefits, unless any associated tax cuts outweigh the negative effect of less generous social insurance. The biggest winners from this policy are the unemployed people who get jobs (to the extent that unemployment falls as a result of the policy).
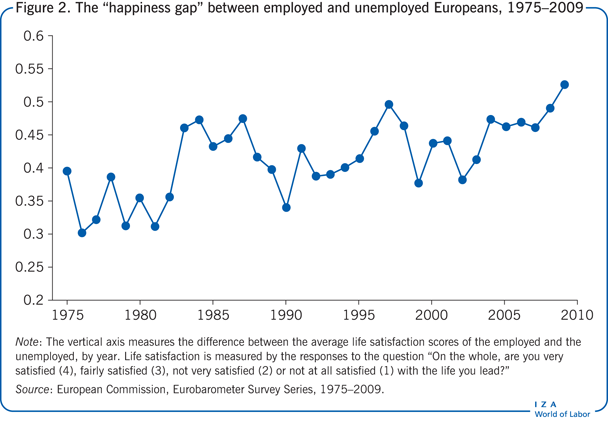
Figure 2 plots the difference in well-being between the employed and unemployed in Europe over nearly four decades (referred to as the “happiness gap”). It is derived by subtracting the average happiness scores for the employed from the average happiness scores for the unemployed for each year (shown in the Illustration). The gap is due not only to the loss in income but also to the psychological cost of losing one’s job. The graph provides an informal means of testing the hypothesis that the welfare state has made life too easy for those looking for jobs compared to those that have jobs. It tells us whether the extra income coming from more generous benefits has raised the well-being of the unemployed to the extent that it has become close to the well-being of the employed, who help fund these payments. That hypothesis is not supported by the data, since the “happiness gap” has not fallen. If anything, the trend has been upwards.
Considerations when utilizing happiness data
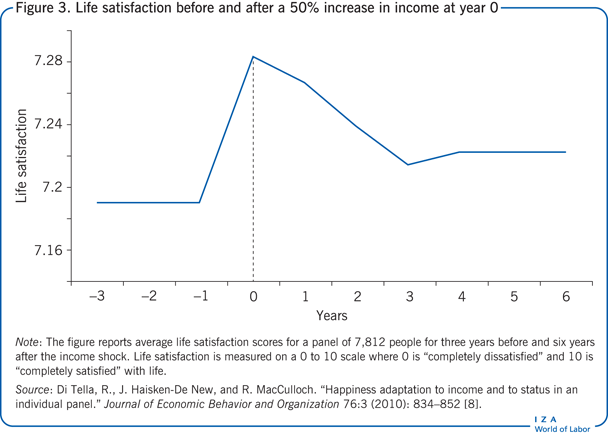
One issue that complicates the use of happiness data for evaluating labor policies is that their impact on well-being may differ in the short term from the long term. For example, Figure 3 shows how a measure of well-being adapts to changes in a person’s income. It uses a panel data set from Germany that has a question asking: “In conclusion, we would like to ask you about your satisfaction with your life in general, please answer according to the following scale: 0 means completely dissatisfied and 10 means completely satisfied: How satisfied are you with your life, all things considered?” The figure shows the results from a simulation whereby a person is handed a (permanent) 50% increase in their income at one point in time. It shows how most of the initial impact on life satisfaction is lost over the ensuing four years. Furthermore, people appear to adapt differently to different kinds of shocks. For example, a change in job status has longer lasting effects on happiness than a change in one’s income [8]. Testing hedonic adaptation theories related to life events like falling unemployed, divorce, or changes in one’s job status or income, is presently one of the most important research agendas in “happiness economics.”
Perhaps the biggest potential shortcoming of the “happiness” approach concerns the dilemma over which measure of well-being to use. There are potentially many different measures that can be constructed. Three broad categories have been identified by psychologists relating to (1) evaluation (a global judgment on how close we are to “the good life” captured by questions like “On the whole, are you satisfied with the life you lead?”); (2) experience (feelings over short periods of time) captured by questions like “Are you happy these days?”; and (3) eudemonic (reports of realization of a person’s potential and degree to which their life has meaning and purpose) captured by questions like “To what extent do you get a chance to learn new things?”. The OECD has guidelines recommending collecting data under each of these categories and the Office for National Statistics in the UK is presently doing so [9]. In the US, the Panel on Measuring Subjective Well-Being in a Policy-Relevant Framework of the National Academies of Sciences concludes that “there is strong evidence that multiple dimensions of SWB [subjective well-being] coexist” [10].
Unfortunately, there is still a lack of consensus over which survey questions are the best to use. Economists think in terms of a single measure of well-being, which captures a person’s “utility” or “welfare.” However, psychologists believe that there are different categories (described above), which each capture different aspects and cannot necessarily be aggregated into one summary measure. Another serious difficulty when using happiness data for policy evaluation is ambiguity over the time horizon used by individuals in framing their answers. Some evidence suggests that people partly look to the future, especially when answering the life satisfaction question, with its reference to “the life you lead” (as opposed to “happy these days”).
When psychologists hear economists refer to “instantaneous utility,” they tend to interpret it as referring to the feelings that people experience over a short period of time. One way to measure “instantaneous utility” is to use the “day reconstruction method,” whereby people report the proportion of their time devoted to different activities during a day, and also the intensity of their feelings experienced during each activity. Examples include being “happy” or “enjoying oneself” (positive emotions) and “frustrated,” “angry,” or “worried” (negative emotions) that are reported on a zero to six scale, where zero means “not at all” and six means “very much.” The day reconstruction method involves creating an average of these positive and negative feelings, weighted by the duration of each activity [11].
Some researchers have investigated how closely related the different measures of well-being are. For example, the day reconstruction method can be used to measure the feelings of employed and unemployed people, and the numbers compared with the reported life satisfaction of these same two groups. Although employed people are more satisfied with their lives than the unemployed, it turns out that the net (positive and negative) emotions that these two groups experience during the day are not significantly different [12].
Other work has found that people who report high levels of life satisfaction are also likely to have high eudemonic well-being (again, eudemonic well-being refers to a person’s perception about whether they have fulfilled their potential and to what extent their life has meaning and purpose). Several individual-level factors, like marriage and higher income, are positively correlated with both of these dimensions (life satisfaction and eudemonic well-being). The fit is not perfect, however. For example, men report lower levels of happiness and life satisfaction compared to women, but higher levels of eudemonic well-being.
Much effort has been expended on trying to “validate” the responses from happiness surveys by showing that they are correlated with, for example, “Duchenne smiles” (which are associated with true enjoyment) and left-frontal brain activity (which is where pleasurable experiences are focused). Some researchers argue that physiological (or “biometric”) measures of well-being, like heart rate and blood pressure, should also be used. These kinds of data are only just becoming available across many countries and over many years.
In summary, it is difficult to determine the best questions to pose to measure well-being accurately. Should one ask a person to evaluate their life satisfaction or to report the positive and negative feelings that they are presently experiencing? Or should one measure the extent to which a person is fulfilling their potential? Or maybe it is best to instead use physiological measures? These issues remind us that the measurement of well-being is still in its infancy, and that it is hard to predict how effective this research will be over time.
Limitations and gaps
The issue as to whether a person’s well-being can be summarized by a single measure or whether there are different aspects of well-being that cannot necessarily be aggregated into one summary measure remains unresolved. Uncertainty about the time horizon used by people in framing their answers to well-being questions also limits the use of happiness data.
A new development is the “mappiness” smartphone app from the London School of Economics and Political Science, whereby volunteers, whose geolocation is tracked, report their happiness at least once a day. Most happiness studies that use such survey data, compare different people’s scores. However, it may not be valid to do so, as some people exaggerate their “true” level of well-being, whereas others report modestly. This problem may be overcome by focusing on large groups instead of comparing two individuals. Provided there are similar numbers of modest people and “exaggerators” within each group, we may not expect systematic reporting biases. To reduce biases further, one can take the average happiness of two groups and compare changes over time by using panel or cross-sectional time-series data.
Another way of controlling for different ways in which people interpret and respond to the same happiness question is to use the “vignette” approach, which measures issues known as “differential item functioning.” “Anchoring vignettes” are short descriptions of hypothetical scenarios which respondents are asked to rate. Since respondents evaluate the same vignette, they should assign identical ratings to that anchoring vignette. Hence any differences between individuals in their ratings can be attributed to differential response styles and used to help remove biases coming from modesty and exaggeration when replying to happiness surveys [13]. More appropriately, resolving these issues is an important challenge facing happiness researchers.
Summary and policy advice
Using happiness data for policy evaluation departs from the prevailing tradition in economics that is skeptical about using direct measures of utility. Instead, economists typically try to quantify all of the costs and benefits of a policy change in monetary terms, which can be hard to do.
In support of happiness data, they help us escape from the often ambiguous welfare predictions coming from theoretical models. For example, are lower unemployment benefits good for society due to increasing incentives to find a job, or is this effect outweighed by a greater fear of unemployment? In this context, happiness data can be used for instance to measure the overall welfare effect of a change in benefits directly, both for the whole population and for specific sub-groups.
Conversely, it is difficult to know which measure of well-being is best to use. There are also controversies about how much and how quickly a person’s perceived well-being adapts to different kinds of events, throwing into question the short- versus long-term effects of a policy change. The degree to which different people’s happiness scores can be compared is also a subject of debate.
So, happiness data have their limitations. However, the alternatives, like welfare predictions coming from theoretic models, or leaving things to politicians’ intuitive judgment, also have their limitations. Therefore, happiness data should be used as an important additional tool to help evaluate policy choices.
Acknowledgments
The author thanks two anonymous referees and the IZA World of Labor editors for many helpful suggestions on earlier drafts.
Competing interests
The IZA World of Labor project is committed to the IZA Guiding Principles of Research Integrity. The author declares to have observed these principles.
© Robert MacCulloch