Elevator pitch
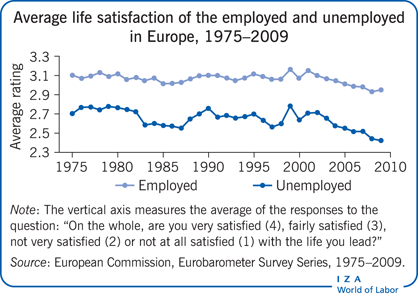
Imagine a government confronted with a controversial policy question, like whether it should cut the level of unemployment benefits. Will social welfare rise as a result? Will some groups be winners and other groups be losers? Will the welfare gap between the employed and unemployed increase? “Happiness data” offer a new way to make these kinds of evaluations. These data allow us to track the well-being of the whole population, and also sub-groups like the employed and unemployed people, and correlate the results with relevant policy changes.

Key findings
Pros
By measuring the welfare effects of a policy change directly, “happiness data” may lessen reliance on theories; they can capture all of the costs and benefits of a policy that otherwise may be hard to determine and aggregate.
“Happiness data” can provide estimates of the welfare effects of a policy on different sub-groups.
“Happiness data” may offer a better way to estimate costs and benefits than “willingness-to-pay” surveys that are notoriously unreliable.
Cons
It is difficult to determine the best questions to pose to measure well-being accurately.
It is unclear whether people’s happiness scores can be compared as different groups may self-report the same level of well-being differently.
There is uncertainty over the short- versus long-term impact of shocks on happiness and some studies show strong adaptation to income.