Elevator pitch
Stability and change are essential elements of social reality and economic progress. Cross-sectional surveys are a means of providing information on specific issues at a particular point in time, though without providing any information about the prevailing stability. Limited information on change can be obtained by retrospective questioning, but this is often impaired by “recall bias.” However, valid information on change is essential for assessing whether phenomena such as poverty are permanent or only temporary. Panel data analyses can address these problems as well as provide an essential tool for effective policy design.
Key findings
Pros
Repeated observations of the same individuals over time show processes of change.
With panel data, the processes of maturation (aging) can be differentiated from generational differences.
Sample selectivity and biases due to omitted variables can be controlled with panel data.
The temporal order of effect and cause is known when using panel data.
Cons
Observing individuals over time is challenging and the number of individuals lost in following panel waves (“panel attrition”) may be substantial.
It is difficult to capture natural changes of the population and processes of migration in survey design.
Repeated measurements may elicit stereotypical and streamlined answers; measurement instruments may vary over time, compromising comparability.
Panel studies are costly as they involve long-term investments in terms of financial and human resources.
Author's main message
Collecting panel data requires a considerable amount of financial and human resources, and provides a serious challenge to survey researchers to keep the data representative and comparable over time. Nevertheless, panel data present an invaluable tool to counter numerous types of biases that can be inherent to conclusions from other data structures. Moreover, with panel data the temporal order of possible causes of a given effect is known through repeated measurements at the individual level, which means that causal conclusions and policy recommendations have a much sounder grounding.
Motivation
Panel studies are a particular type of research method that analyze information collected on individuals and households (and increasingly on firms, countries, or other entities) repeatedly over time. The data can be drawn from surveys, official statistics, or other sources (e.g. process-produced data). The use of panel data was first introduced by F. Lazarsfeld in the 1940s in an analysis of public opinion, using market research gathered over time [2], [3]. The Erie County Study, which was the first classical panel study, analyzed voting behavior during the 1940 presidential campaign and was carried out by the Bureau of Applied Social Research at Columbia University in the US [4].
Panel studies are now widely used in research across the social and life sciences [5]. Notable US examples are the American National Longitudinal Surveys of Labor Market Experience (NLS) and the University of Michigan’s Panel Study of Income Dynamics (PSID). Both were initiated during the 1960s and have since become the prototype examples for household panel data collection. Other notable household panel studies from Europe include the German Socio-Economic Panel Study (GSOEP), the British Household Panel Survey (BHPS, which has since become the UK Household Longitudinal Study, or Understanding Society), and the Swiss Household Panel (SHP).
During the 1990s, Eurostat began to coordinate the European Community Household Panel (ECHP) as a means of gathering comparable information across EU member states. This has since been replaced by the European Union Statistics of Income and Living Conditions (EU-SILC). Other examples of similar panel studies outside the US and Europe include the Korea Labor and Income Panel Study and, in Australia, the Household, Income and Labor Dynamics Survey. Some of these data have been integrated in a large comparative panel data set, the Cross National Equivalent File (CNEF), which includes data from Australia, Canada, Germany, Korea, Russia, Switzerland, the UK, and the US.
Panel data studies can also be based on information on countries, organizations, or any other social unit. A country example is the Social Expenditure Database (SOCX), undertaken by the OECD, which includes annual social policy indicators for 34 OECD countries since 1980. An example of an organization panel study is the IAB Establishment Panel (IAB-EP) of the Institute for Employment Research (IAB) of the German Federal Employment Agency, which is an annual survey of German establishments.
Household panels can be based on surveys, as in the GSOEP, while the OECD’s SOCX uses official government statistics. Thus, while the methods of data collection can vary between panel data sets, the meaning of “panel” is consistent in that it defines a particular type of data collection method that repeatedly measures the same unit over time. This article focuses particularly on panels of individuals, often termed “micro panels.” Technically, micro panels are panels with many units (large N, with N being the number of units) and limited numbers of repeated measurements (small T, with T being the number of observation periods, most often years).
Discussion of pros and cons
Panel studies are currently used extensively in social science research, principally because they can provide more robust results than other research methods. However, the complexity of the research design of panels presents a number of challenges as well as benefits.
Measuring change
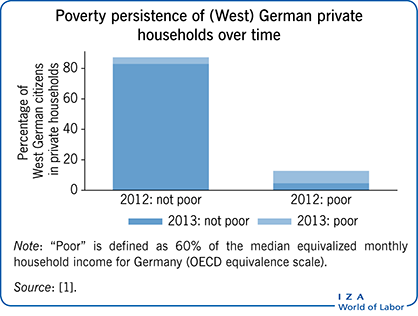
The principal reason for collecting panel data is to analyze the process of change over time, particularly at the level of the individual. A classic example that illustrates this is from recent research on poverty, in which it was suggested that a measurement of individual poverty based on one point in time does not capture whether that individual is in a permanent or temporary state of poverty. Depending on which is prevalent, anti-poverty policies should be directed toward those individuals who either move in and out of poverty over time, or who are permanently poor. Naturally, such individuals could be identified by retrospective questions in cross-sectional surveys, but this could be prone to recall errors and would represent only a very simplistic approach. A more accurate and useful measure would be obtained by observing the same individuals repeatedly over time—which is essentially what panel surveys do.
Voting and consumer behavior are other areas of social enquiry that illustrate the usefulness of distinguishing between stability and change at the individual level. One example of this might be a situation where aggregate support for a political party might be constant over time, but within that there could well be only a minority of “constant” supporters relative to a fluctuating majority of voters at the individual level who may be changing their party allegiance over a given period of time. Political parties have to take this combination of voters into consideration when designing their party campaigns, and may necessarily have to adjust their approach toward the different voter types in order to ensure an overall stable majority.
This sort of wider consideration and analysis at the individual level is also relevant for producers of consumer goods. While they must be aware of, and cater for, their loyal customers, they must also bear in mind how to attract new customers in order to be able to increase their market share.
Panel data versus cross-sectional analysis
There is some argument among scholars regarding the extent to which panel data should be used in analysis. Some maintain that, in addition to learning about individual change, panel data can help to assess levels and trends over time, in much the same way that cross-sectional data analysis does (though note that cross-sectional analysis does not provide information about change at the individual level). However, others argue that panel data should be used purely for analyzing change, as there can be an issue of “panel attrition” (i.e. individuals dropping out of the observation/survey) when it is used to look at long-term trends. On balance, however, the academic community is of the opinion that it would be a waste of financial resources to focus only on analyzing change, as panel data can be a rich source of information on levels and trends, and that cross-sectional surveys often do not capture certain variables of interest.
As an illustration, it is useful to consider how in labor market analysis separating generational effects from age or maturation effects can be important. Accordingly, research on labor market integration of young adults suggests that successful integration, among other things, depends on when these adults entered the labor market (i.e. whether in times of economic prosperity or downturn) and how long they have been active in the labor market (i.e. their labor market experience). Therefore, empirical analysis has to compare young adults from different cohorts (generations) of labor market entrants with different years of labor market experience (times of maturation in the labor market). “Generation” refers to the time when the particular unit that is being studied entered the period during which the study extends—in this case, the year of entry into the labor market. “Maturation,” on the other hand, refers to the period that has elapsed since the particular study began. A cross-sectional approach does not allow this sort of differentiation, but as a panel design observes units repeatedly over time it can provide an analysis of how maturation affects different generations, or cohorts.
Although it would be feasible to combine several cross-sections over a period of time in order to achieve the same analysis, such a “pooled cross sectional design” would provide only what are referred to as “synthetic cohorts” (because the individuals that are observed in each period may differ from one period to the other), whereas the panel design provides “true cohorts”—i.e. the same individuals who have been measured repeatedly over time.
Bias, selection effects, and causality
An additional challenge confronting empirical research is that is it often difficult to know all the determinants of the variables used in the analysis, and even when they are known it can be difficult to measure them. This means that studies could be incomplete and results prone to bias. One example of where this can be relevant is when measuring the returns to education, as future returns are not determined only by schooling and training but also, for example, by innate ability. When working with cross-sectional data it is difficult to deal effectively with these omitted variables and possible biases, unless certain assumptions are made or a way is found to measure the omitted variables, which can be challenging.
A related problem is selective samples, which can be particularly virulent when evaluating policies in a natural setting. For example, if an analysis is made on the effect of on-the-job training on wages, it is necessary to take into account that certain employees (often the more productive ones) are more likely to participate in such training opportunities (they are thus a positive selection of all employees and probably more likely to have higher wages, also independent of any training) [7]. Similarly, with new payment schemes: if they are a choice option and not mandatory for all employees, they may attract only certain employees. Consequently, any productivity increase induced by the payment scheme may be partly due to the characteristics of those employees [8]. While the use of cross-sectional data can help in modeling the selection process, if the selection model is misspecified, then the estimated policy effects can also be biased. In contrast, panel data allow for a degree of control over selection issues and potential related biases.
By extension, assessing causality is also challenging, not least because there are a range of definitions of causality across the social sciences and within econometrics [9]. However, a simple explanation of causality is enough to understand why this research design can be relatively better than other methods. First, causality requires two variables (X and Y) to be correlated with each other, but also, importantly, that there is no possibility of them being correlated as a result of them both being simultaneously correlated with a third, unknown, variable. Second, it must be determined which of the two variables has a causal effect upon the other, which can be achieved by conducting experiments (e.g. randomized control trials involving treatment and control groups) that can demonstrate the effect of each variable on each other.
Relative to panel data, cross-section is a weaker source of information for determining causality, because it does not permit an analysis of change over time, and therefore it is not able to correct for unknown variables that are also correlated with X and Y and hence influence the perceived correlation of the original two variables. Moreover, panel data permit a “disentanglement” of the changes of X and Y: Because observations are conducted over time it is known whether changes of X precede changes of Y or vice versa.
Sample size and measurement error
Samples are a crucial part of surveys, as they allow the researcher to take a representative “sample” of the total population under study. If the survey is looking at individuals, households, or firms, for example, it is relatively easy, given adequate resources, to develop samples involving several thousand units. However, if the total population under study is composed of a relatively small number of units to begin with, it makes little sense to draw a sample. For example, if political and social scientists wish to analyze macro phenomena, such as political systems or specific groups of countries (e.g. OECD member countries, which includes only 34 units), a small sample would limit the degree of statistical analysis. In such circumstances, scholars would recommend extending the study in the time dimension by using a panel design that measures each macro unit at several points in time.
Measurement error is a common feature of social science data, in relation to both objective and subjective characteristics (e.g. income and life satisfaction, respectively). When random, measurement errors result in less reliable statistical association and consequently less certainty with regard to specific effects. For example, a random error may be a result of respondents reporting slightly different values when asked over time to provide information on income or life satisfaction. The error is more systematic when certain individual respondents consistently under-report or over-report these values. Systematic measurement error can provide a biased picture and lead to misguided conclusions regarding appropriate policy.
Because panel data look at change processes over time, it is important to ensure that the data used are reliable and that any observed change, or stability, is not due to measurement error. Due to the fact that panel data compare the measurement of particular variables over time (i.e. “test–retest reliability”), they provide a much more solid and reliable analysis than cross-sectional data, which would require parallel measurements of the same framework at one point in time, an assumption that may be difficult to defend in certain applications. Nevertheless, panel data can also be prone to measurement error, but extending the analytical panel data over longer periods of time mitigates the risk of measurement error.
Representing the population
As has been demonstrated throughout this article, panel data have clear benefits and advantages over other research designs, particularly cross-sectional analyses. However, panel data are not a perfect solution and certainly not without their challenges. One of the biggest challenges is how to represent the population over time. Although panel data can address questions that cross-sectional data cannot, the fact remains that representing a population over time is extremely more complex than presenting a snapshot of the same population at any given point in time—as by their nature, populations change. A respondent unit (e.g. a member of the public, a household, or a firm), who was included in the first point of analysis, may not be available at a subsequent point of the analysis, for a number of reasons: an individual may choose not to supply information, or may have died; a household may have broken up or moved; or a firm may have gone out of business.
From this panel attrition and population change selectivity problems arise. Hence, to exploit the unique features of the panel design, a lot of effort must be invested to minimize these problems of representation (e.g. by tracking respondents, imputing and re-weighting non-responses, drawing refreshment samples, or implementing a so-called “rotating panel” design, where equally-sized sets of sample units are brought in and out of a sample following a specified pattern).
A useful example in this respect would be the GSOEP, which is a longitudinal survey of (in the beginning) approximately 11,000 private households conducted over a period of (up to now) 20 years, from 1984 to 2014. The information includes household composition, employment, occupations, earnings, health, and satisfaction indicators. The individual household members who were interviewed at the beginning were due to be re-interviewed every subsequent year. However, the challenge was that many of these individuals may have moved away, or subsequently refused to participate, while some, of course, may have died. The result of this is missing information relative to the first sample—which could be temporary (no interview in a specific year) or permanent (dropout out of the panel). Permanently missing information is more problematic than temporarily missing information, as gaps in information can be imputed from other years. Permanently missing information, however, is more difficult to accommodate, particularly if it is a result of selective attrition, which would then result in biased measurements over time.
In general, it is more difficult to represent a population over time than at a specific point in time, as the population itself changes over time. This can be due to natural population changes as a result of births, deaths, marriages, and divorces; or, alternatively, as a consequence of migration. GSOEP tried to capture the natural population changes by including in the survey all new GSOEP household members as they emerged (e.g. children turning 16 years of age), or new members through marriage, while also monitoring those existing GSOEP members who may have gone on to found a new household (e.g. as a result of divorce or young adults leaving home). However, what is not captured through this process of inclusion are changes in the population that are not related to the existing GSOEP households; for instance as a result of significant migration movements.
Thus, it is not only panel attrition that can compromise the effectiveness of panel design, but also significant changes in the population. The GSOEP example is a good illustration of this, in that even if there was no panel attrition and the GSOEP accurately reflected the German population from 1984, the effect of German reunification in 1990, as well as the subsequent massive immigration of native Germans (“Aussiedler”) and today’s significant influx of refugees and asylum seekers, means that the 1984 population is by no measure an accurate reflection of the population of Germany today. By contrast, a cross-sectional survey would sample the present population and therefore be more representative.
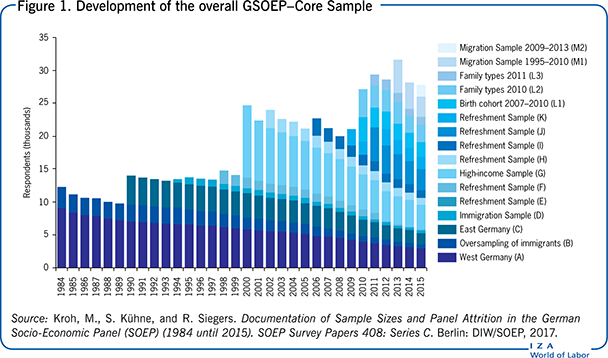
In summary, although there are clear benefits to using panel data, there are selectivity problems due to attrition and population changes, though these can be mitigated to an extent through investing considerable effort in measures designed to minimize their effect. Such measures include: (i) intensified fieldwork (a tracking concept) to contact as many of the previously selected households as possible and to motivate as many of the former respondents to continue participating in the panel; (ii) adjusting for non-responses by imputing (in the case of temporarily missing information); or (iii) compensating for non-responses by re-weighting the remaining units (in the case of panel attrition). However, at a certain point the loss due to panel attrition will be so large that weighting the few remaining units ceases to make sense. At that point, a refreshment sample is necessary. Changing populations, on the other hand, can be dealt with by drawing new samples, either at regular points in time (rotating panels) or when necessary (e.g. after a period of massive immigration). The EU-SILC—which is a cross-sectional and longitudinal sample survey—is an example of the first sort, while the GSOEP immigration sample (which began in 1995) is an example of the second sort. Figure 1 illustrates how the 1984 subsamples of the GSOEP have been augmented during the course of the panel study by various samples either addressing certain sub-populations or refreshing the overall sample.
Validity and reliability of measurement over time
Another challenge of panel data is the validity and reliability of measurement over time. Many social science researchers are of the opinion that repeating the same question time and time again impacts upon the validity of the measures. However, in the literature on this so-called “panel effect” (or “panel conditioning”) there are clearly two sides to the argument. On the one hand, while it is true to say that repeating the same question over time allows the respondent to rehearse and refine the response and to strategically side-step or avoid challenging questions [10], on the other hand, it could also sharpen the attention and encourage a learning effect as respondents develop their understanding and knowledge of a topic [11]. For example, if an interviewee has difficulty, for whatever reason, in answering a question in the first interview on individual or household income levels, s/he may adjust to the question and be more ready and prepared at subsequent interviews to answer more comprehensively and accurately [12], [13]. Thus, although a panel data approach may be thought to potentially bias results, it can also serve to improve the response and validity.
A further challenge for panel data design is that they must be flexible and adaptable. A rigid questionnaire does not allow for the fact that some questions can lose potency and relevance over the course of the study. A question that originally seemed strong and relevant may prove to be less so on repeated applications. Similarly, changing technology leads to changing methods and modes of interview, which compromises comparability. Also, new issues may become relevant according to changing circumstances and prevailing conditions. In summary, panel surveys can be compromised if they allow non-equivalent survey instruments to dominate. Therefore, constant monitoring and frequent reassessments are necessary in order to ensure appropriate equivalence over time.
Financial considerations of panel design
All research is influenced by financial considerations, whether in terms of actual costs, time, resources, or capacity. While a panel study is obviously more expensive in these respects than a one-off cross-sectional study, it may not be more costly than a series of cross-sectional studies that are “pooled” over time in order to provide a longitudinal view. The resource requirements for both types of design are similar in terms of data management, weighting, and documentation. However, the costs of sampling and data collection can differ: while a panel design requires ideally only one initial sample, cross-sectional design requires a new sample for each analysis, which would require additional resources.
Data collection is also resource intensive for both panel data and cross-sectional designs. However, although the panel design can be costly in this respect (as they have to invariably make accommodations for mitigating against the effect of panel attrition), it probably works out at a lower cost than having to select multiple samples, as in pooled cross-sectional designs. Nevertheless, because a single-wave panel design is probably slightly more costly than a one-off cross-sectional survey, it is more challenging to persuade funding bodies and policymakers to support panel design surveys, as they require more than one wave.
Limitations and gaps
Panel data are currently “in vogue.” Germany is a good example: recently many different panels have been initiated focusing on different topics, such as family relations (Panel Analysis of Intimate Relationships and Family Dynamics, PAIRFAM), education (National Educational Panel Study, NEPS), labor market and social security (Labor Market and Social Security, PASS), and health (Nationale Kohorte, NAKO). Clearly, there is a demand for more specialized information and for sampling designs that are not satisfied by the traditional multi-topic panels, such as the GSOEP. Naturally, an all-encompassing panel study is not feasible; not only because of its excessive costs, but also because it would be unreasonable to assume that all creative scientific interests could be covered with only one study.
Nevertheless, as previously discussed, each panel study is a long-term investment that requires considerable financial and human resources. From that viewpoint, each funding proposal for “yet another” panel study has to have strong arguments as to why its research questions cannot be answered with the panel studies already available. This implies that existing panel studies have to make their data accessible for scientific use as early as possible. Unfortunately, not all panel projects have the necessary resources for documenting and disseminating their data in a reliable and user-friendly form.
Moreover, relatively little research has been done on how to combine data from different panel studies (e.g. to study the relationship between income equality, well-documented in the GSOEP, and public health, best covered in the NAKO). It seems as if the necessary tools from statistics (matching) and information science (record linkage) are available, but what is missing are practical applications that show users how to solve such inter-study research questions, such as the former inequality–health nexus. Of course, this implies that standards of data documentation and dissemination have been defined and issues of data protection have been solved.
Summary and policy advice
Panel studies are a necessary research tool for the social and economic sciences, as well as for epidemiology and public health. Panels can answer almost all research questions that would usually be answered with cross-sectional data. When it comes to testing theories and designing policies, they even overcome some of the restrictions and potential biases of cross-sectional data. Although they do not achieve the causal validity of experimental designs, they are nevertheless an indispensable tool because experimental designs are often difficult, if not impossible, in research on human subjects.
Moreover, the external validity of experiments (i.e. the ability to generalize their findings to real-life situations) is often unclear. In a way, panel studies are the large-scale research facilities for research on human behavior and attitudes in real-life settings, as the German Electron Synchrotron (DESY) or the European Organization for Nuclear Research (CERN) are for the natural sciences. Therefore, it is important that national and international research politics and funding organizations develop action plans on how to guarantee the long-term functionality of important panel studies with respect to financial and human resources, organizational structure, connection with the university system, quality and human resource management, and educational programs.
Acknowledgments
The author thanks two anonymous referees and the IZA World of Labor editors for many helpful suggestions on earlier drafts. Previous work of the author (together with Katrin Golsch and Alexander Schmidt-Catran) contains a larger number of background references for the material presented here and has been used intensively in all major parts of this article [5].
Competing interests
The IZA World of Labor project is committed to the IZA Guiding Principles of Research Integrity. The author declares to have observed these principles.
© Hans-Jürgen Andreß