Elevator pitch
Spain, the fourth largest eurozone economy, was hit particularly hard by the Great Recession, which made its chronic labor market problems more evident. Youth and long-term unemployment escalated during the crisis and, despite the ongoing recovery, in 2018 were still at very high levels. The aggregate rate of temporary employment declined during the recession, but grew among youth. Most interesting have been the narrowing of the gender gap in labor force participation, the decline in the share of immigrants in employment and the labor force, and the overall increase in wage inequality.
Key findings
Pros
Employment has grown at an average annual rate of 2.4% since 2014.
The gender gaps in labor force participation and temporary employment were smaller in 2018 than before the recession.
The overall rate of temporary employment decreased in the wake of the Great Recession.
The share of immigrant employment started growing again after 2014, albeit slowly.
Both overall monthly wage inequality and inequality in the lower half of the monthly wage distribution started decreasing slowly in 2013.
Cons
Youth and long-term unemployment skyrocketed during the Great Recession; in 2018 they were still both very high and very far from their pre-crisis levels.
Male labor force participation fell because of the drastic reduction in young men’s participation in the aftermath of the crisis.
The rate of temporary employment escalated significantly among youth.
Immigrants were hit particularly hard by the Great Recession.
Real wages declined during the recession and have not returned yet to their pre-recession levels; this decline was especially pronounced for low-wage workers.
Author's main message
Despite the ongoing recovery, the Spanish labor market is still far from doing well. Youth unemployment as well as both temporary and long-term unemployment remain significant problems. Issues also exist with respect to immigrant workers and wage inequality, particularly for lower-wage workers. On the positive side, the labor force participation gender gap has shrunk considerably. Policymakers could combat the long-term unemployment challenge by putting more efforts into the design, implementation, and evaluation of well-targeted active labor market policies.
Motivation
Spain, the fourth largest eurozone economy, was one of the OECD countries hit hardest by the Great Recession. Many aspects of Spain's labor market have suffered as a result and, despite some recovery, significant challenges remain. It is thus useful to highlight those areas of the Spanish labor market that are doing well and those that are still performing poorly. This is crucial information for understanding labor market policy debates as well as the general background of academic discussions.
Discussion of pros and cons
Aggregate issues
The Great Recession hit Spain in 2008 after the longest period of expansion in its economic history (1994–2007). As in many other EU countries, the Great Recession in Spain consisted of two consecutive recessions. The first recession (second quarter of 2008 to fourth quarter of 2009), triggered by the international financial crisis, was followed by a short-lived recovery and then a second recession (fourth quarter of 2010 to second quarter of 2013), unleashed by the eurozone crisis. These two recessionary periods, as established by the official timing of recessions of the Spanish Business Cycle Dating Committee, are shown with shaded areas in all figures.
The Spanish double-dip Great Recession has been by far the longest since 1975, when General Franco died after 36 years of dictatorship and the transition to democracy began. The effects of the external negative shocks on the economy were aggravated by the bursting of a big housing bubble along with a large-scale banking crisis and subsequent reduction of bank credit to firms. Additionally, Spanish labor market institutions, often labeled as dysfunctional, consisted of dual employment protection legislation and a rigid collective bargaining system. This combination caused the labor market to adjust to negative shocks mostly through dismissals. In this context, employment contraction and unemployment growth were more dramatic during the Great Recession than in any of the previous crises for which data are available.
Figure 1 shows the aggregate unemployment, job-separation, and job-finding rates from 2002 through 2018. The job-separation rate is computed as the number of non-working individuals who had a job in the previous quarter expressed as a share of all employed individuals in the previous quarter. Analogously, the job-finding rate is the number of working individuals who were out of work in the previous quarter expressed as a share of all employed individuals in the previous quarter. Note that the two rates are comparable because they are both computed as a share of the same group of individuals (those who were working in the previous quarter), and the difference between the job-finding and job-separation rates is the net employment growth rate. Quarterly values were then averaged over each year to obtain annual values, as is the case with all the labor market quantities shown in this article.
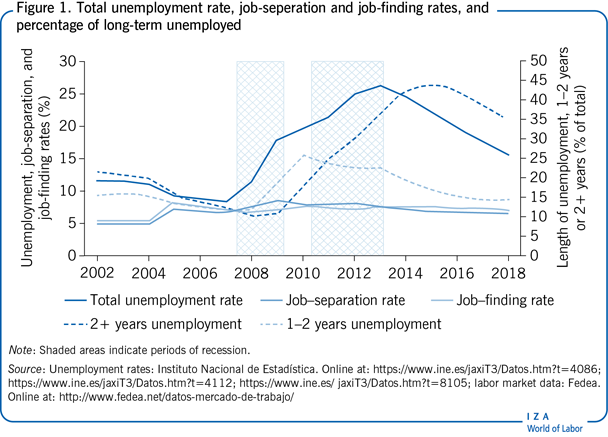
Unemployment almost reached 19% at the end of the first recession, peaking at about 27% in early 2013. It has been on the decline since then. Moreover, since 2014, the job-finding rate has been higher than the job-separation rate, which implies that new jobs were created. In particular, employment has grown at an average annual rate of 2.4% since 2014. However, the share of the working-age population in employment stood at 49.7% in 2018, 4.7 percentage points below its pre-crisis rate, representing a jobs deficit of 1.252 million. By 2018, aggregate unemployment was still at 15.3%, about 7 percentage points higher than it was in 2007. The high level and pronounced volatility of the unemployment rate is not a new phenomenon, as this marks the third time that it rose above 20% in less than 30 years.
Further reasons for concern can be found when dissecting this aggregate scenario, as long-term unemployment reached unprecedented levels in the aftermath of the Great Recession. According to the standard definition in Spain, unemployed individuals who have been actively seeking work for more than one year are classified as long-term unemployed. Figure 1 further distinguishes between the percentage of unemployed individuals, with unemployment spells lasting between one and two years, and the very long-term unemployed, with spells lasting more than two years. The share of individuals who have been unemployed for one to two years peaked in 2010 at about 26%, while the percentage of very long-term unemployed individuals kept rising until reaching 44.2% in 2015. In 2018, 34.9% of all unemployed individuals (and 5.3% of the labor force) had been out of a job for more than two years, almost three times more than shortly before the Great Recession. Such pervasiveness of long-term unemployment stands out from a historical perspective as well as internationally, with the Spanish long-term unemployment rate being the second largest in the EU (after Greece).
Long-term unemployment in Spain disproportionally affects older and less-educated workers [1]. Moreover, there is a negative relationship between the probability of exiting unemployment and the duration of unemployment spells, so finding a job becomes increasingly harder for long-term unemployed individuals. Hence, Spain's high levels of long- and very long-term unemployment entail a risk of social exclusion for the affected individuals, and getting them back to work is a crucial challenge for policymakers.
The demographics of unemployment: Age and gender
Figure 2 shows another troublesome aspect of the Spanish labor market: its huge rate of unemployment among youth, which is far from being a new phenomenon [2]. Youth unemployment rose dramatically throughout the Great Recession, peaking at 55.5% in 2013, and has been on the decline since then. However, by 2018, youth unemployment was still at 34.3%, almost twice its 2007 pre-recession level.
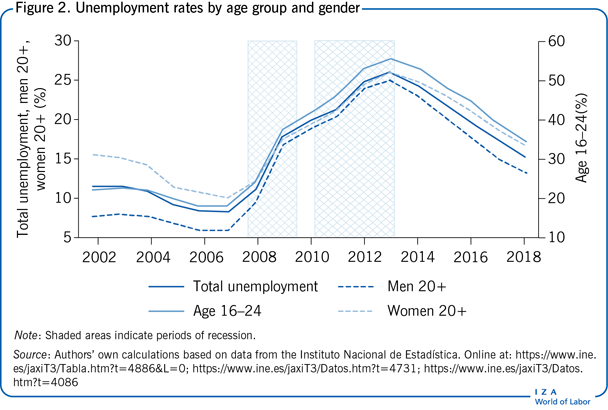
The dual nature of the Spanish labor market, in which temporary contracts with low firing costs and open-ended contracts with high firing costs coexist, likely helps to explain the strong volatility of youth unemployment over the business cycle. Indeed, from peak to trough, the unemployment rate increased by 37 percentage points among young individuals, whose rate of temporary employment is also higher, against a 17 percentage point increase among their prime-aged counterparts.
Despite the fact that the ratio of young to prime-aged unemployment has remained fairly stable since the 1990s in Spain, the concentration of unemployment among youth in several countries (notably in Southern Europe) has been one crucial driver of the increasing divergence of unemployment rates across Europe [3].
Along with the aggregate and youth unemployment rates, Figure 2 also presents the unemployment rates of adult men and women. The unemployment rate of adult women has always been above that of men, and the unemployment gender gap was already decreasing before the Great Recession, during which it reached its minimum of 0.5 percentage points in 2012. However, the unemployment gender gap started widening again after 2012, and by 2018 it was somewhat higher than in 2008.
Labor force participation: Aggregate, by gender and by age
In contrast to the strong counter-cyclical behavior of unemployment, the aggregate labor force participation rate (Figure 3) continued on its upward trend in the aftermath of the international financial crisis. It peaked at 60.4% in 2012 and barely fluctuated thereafter, such that by 2018 it was only slightly lower than in 2007.
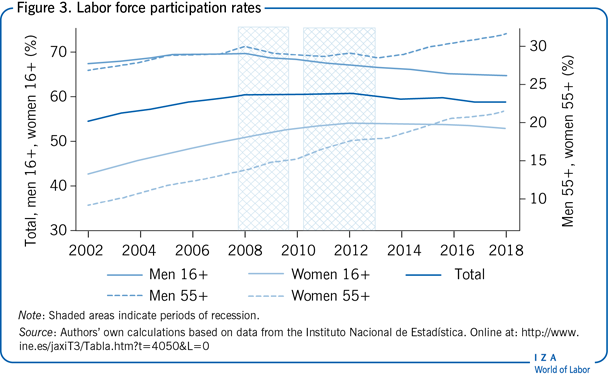
However, this aggregate pattern masks interesting gender differences. Figure 3 also shows that, since the Great Recession started, there has been both a reduction in men's labor force participation, which fell by about five percentage points between 2007 and 2018, and an increase in women's labor force participation, which in 2012 peaked at around 54% and in 2018 was close to four percentage points higher than shortly before the crisis. As a result, the gender gap in labor force participation has narrowed markedly from 19.9 to 11.5 percentage points between 2007 and 2018. While this has been the case for most OECD economies, Spain has experienced the strongest convergence over this time period.
The gender gap in labor force participation has fallen for all age groups since 2007, but further analyses by age reveal other stark differences. In particular, the rise in women's labor force participation was largest among women aged 55 and older, while the participation rate for men in this age group experienced a much smaller increase throughout the recession. The pattern was similar for prime-aged individuals. In contrast, participation fell for both young women and young men, although the reduction in participation was more pronounced for men.
These labor force participation patterns by gender and age suggest that, in the wake of the Great Recession, the “added worker effect” is likely to have been at play for adult women. In other words, adult women's labor supply may have increased as a response to their partners’ job losses and the associated reduction in household income. In contrast, the “discouraged worker effect” (withdrawal from the labor market because of failed searches and dim prospects) may have played a role for young men, given the pervasiveness of youth unemployment and the unprecedented levels of long-term unemployment. In this context, it is worth stressing that, during the crisis, many job losses in Spain were concentrated in male-dominated sectors, in the construction sector in particular, while sectors with more female employment generally fared better. In particular, the contribution of the construction sector to total employment dropped by almost half between 2008 and 2018 as it fell to 6.3%, while the percentage of male versus female workers in this sector hovered around 92% through the same period. In contrast, in the service sector, employment grew from about 68% to 75.5% between 2008 and 2018, while the percentage of female versus male workers remained fairly stable at around 53–54%.
Employment composition: The share of temporary jobs
Figure 4 shows the percentage of employees who have a temporary job in order to illustrate the most visible symptom of the dual nature of the Spanish labor market. Before the Great Recession the overall share of temporary jobs was above 30%, almost three times the OECD average, with temporary employment being more prevalent among women and youth. After its 2006 peak of almost 33%, the rate of temporary employment declined to its lowest point, dipping below 24% at the end of the second recession. This decline illustrates that job destruction during the crisis was disproportionally borne by temporary workers. Since then, the rate of temporary employment has rebounded, but, at 26.8% in 2018, it was still below its pre-crisis level. Interestingly, the gender gap in temporary employment narrowed until almost closing in 2015. By 2018, the gender gap in temporary employment appeared to reopen, but it was still almost two percentage points smaller than at the beginning of the recession.
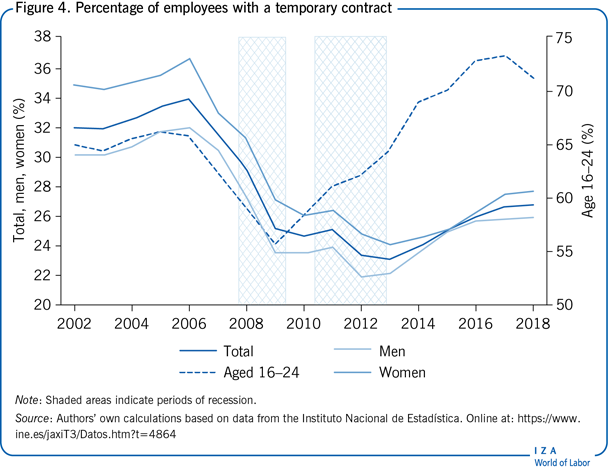
In stark contrast with the decline of the overall rate of temporary employment during the Great Recession, the share of young temporary employees sharply increased during the same period; in 2018, it was 71.2%, almost 9 percentage points above its 2007 level. The rate of part-time employment also increased dramatically among youth during the crisis, as it escalated from 21.2% in 2007 to its peak of around 40% at the end of the second recession. By 2018, it was still as high as 37.3%.
While both part-time jobs and temporary jobs provide flexibility to employers and employment opportunities for certain labor force groups, some concerns remain. In the case of part-time employment, it seems it is becoming increasingly involuntary, as in 2018 54% of part-time workers declared they were in part-time employment only because they could not find a full-time job (against 32% in 2007) [4].
Regarding temporary contracts, in Spain, as in other OECD countries, many young people enter the labor market through this form of employment. However, Spanish youth tend to stay on temporary contracts much longer than elsewhere and face frequent unemployment spells between one temporary contract and the next [5]. Indeed, Spain's transition rates from unemployment or temporary employment into permanent employment are among the lowest in the OECD [6].
Immigration before and after the Great Recession
During the pre-crisis expansionary phase, Spain received large inflows of immigrants who substantially modified the country's demographic structure and joined its labor force. Immigrants, however, were hit particularly hard by the Great Recession [7]. Figure 5 shows the percentage of immigrants in the working-age population, in the labor force, and in the total employed population, all of which were on a rapidly rising trend before the recession. The share of immigrant employment peaked in 2008 at almost 14%, before markedly declining thereafter, reaching a low of 10.6% in 2014. The percentage of immigrants in the working-age population and in the labor force peaked in 2009, one year later than the share of immigrant employment, and by 2018 they had slightly rebounded. In contrast, the share of immigrant employment started growing again after 2014, albeit slowly.
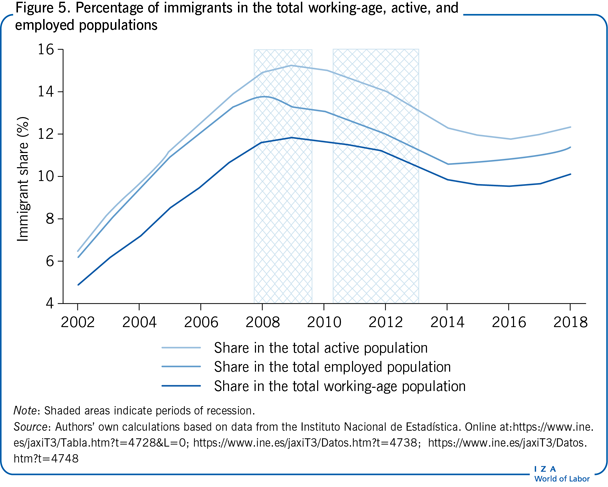
In sum, job destruction during the crisis was disproportionally borne by foreign workers, who were over-represented in the sectors that were hit hardest by the recession, and, as a consequence, Spain has experienced net migration outflows since the beginning of the 2010s [8].
Wage developments
Before going into detail on wage developments please note that in this and subsequent sections inflation is accounted for in order to capture changes over time in the economic well-being of workers. To this end, the Consumer Price Index (CPI) is used to deflate nominal wages and to obtain real wages.
Aggregate developments
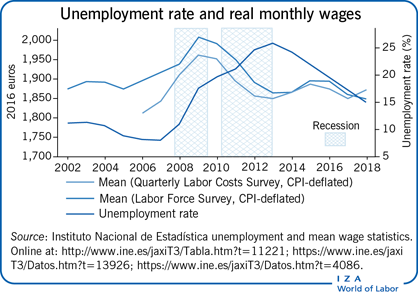
The Spanish Labor Force Survey (LFS) only started including workers’ monthly wages in 2006. Moreover, the Spanish National Statistical Office decided not to ask LFS respondents about their earnings directly and to instead obtain their monthly wages from administrative sources (i.e. tax and social security registries). This implies that wage data are released later than the rest of the data. Hence, in order to obtain a longer annual series on aggregate wages, data are also taken from the Quarterly Labor Costs Survey (QLCS), which is a questionnaire directly filled in by formal establishments throughout the country. Note, however, that the QLCS coverage, unlike that of the LFS, is not comprehensive, as it excludes agriculture, forestry, and fishing employees, household employees, and some public employees.
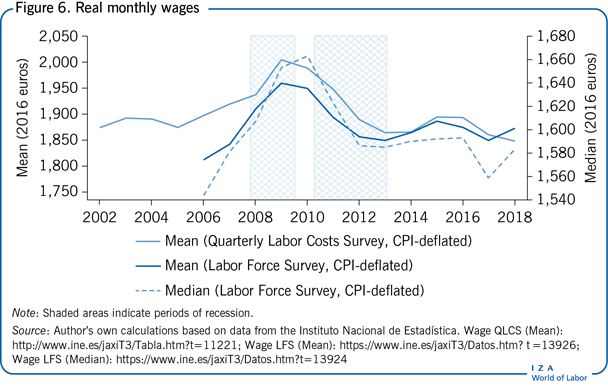
Figure 6 displays LFS mean and median real wages from 2006 to 2018 and QLCS mean real wages from 2002 to 2018. Regardless of the wage measure used, the figure indicates that, while real wage growth accelerated in the few years preceding the Great Recession, real wages fell markedly during the crisis, and have not yet returned to their pre-recession levels. In particular, mean real wages peaked in 2009 before falling to around 93% of their 2009 levels in 2013. Real wage growth has been positive between 2013 and 2015, while real wages declined thereafter, and by 2018 they were still below their 2008 levels. Interestingly, median real wages kept on rising until 2010 despite dramatic job losses, which likely reflects rigidities in the Spanish system of collective bargaining. There is also evidence that wage adjustments were disproportionally borne by young and new employees [5].
Changing wage inequality
Figure 7 presents several indicators to study the evolution of wage inequality from 2006 through 2018. Note that the focus is on monthly wages of all employees (both full-time and part-time employees). There are two main reasons for adopting this focus, despite the marked change in part-time employment since the beginning of the Great Recession. First, labor earnings, whether from full- or part-time employment, are the main component of individual income. Second, there is evidence that the increase in part-time employment was largely involuntary, as most part-time employees would have preferred to work full-time had they been able to. However, additional context is provided by contrasting the results obtained using monthly wages with those obtained using hourly wages.
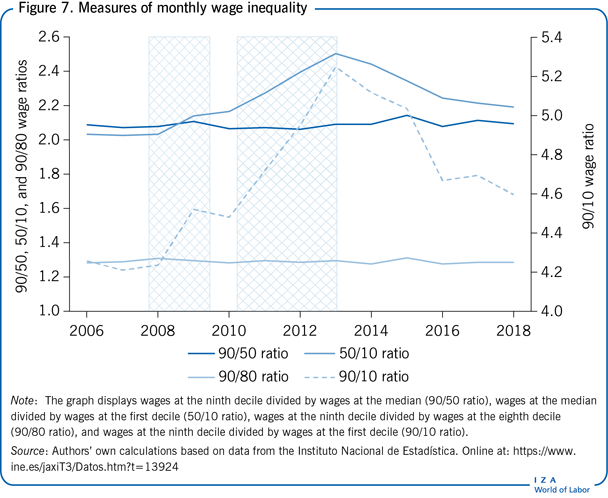
In particular, Figure 7 displays the following ratios of monthly wages of workers at different points of the wage distribution: the 50/10 ratio (wages at the median divided by wages at the first decile), which measures inequality in the bottom half of the distribution; the 90/50 ratio, which measures inequality in the upper half of the distribution; the 90/10 ratio, which can be viewed as a measure of overall inequality; and the 90/80 ratio, which focuses on earners nearer (but still not at) the top.
Consider first the evolution of the 90/50 ratio between 2006 and 2018. This ratio has not fluctuated much over the period, suggesting that wage inequality in the upper half of the distribution has remained fairly stable. Similarly, the 90/80 ratio remained stable. Hence, wage inequality has not risen in the upper half of the distribution either, nor has it increased among earners closer to the top.
In contrast, significant changes in inequality are shown by the paths of the 50/10 and 90/10 ratios. The former has risen by 7.7% and the latter by over 8%. Therefore, wage inequality has increased in general over this period and the overwhelming majority of the increase has taken place in the lower part of the wage distribution. However, both overall inequality and the 50/10 ratio started decreasing in 2013 in the wake of the recovery. The evolution of monthly wage inequality described here is crucially linked to the (largely involuntary) increase in part-time employment since the beginning of the crisis. In fact, hourly wage inequality barely changed (or even slightly declined) since 2008.
Limitations and gaps
The biggest gap in describing recent developments in the Spanish labor market is in the area of earnings, and is due to two main reasons. First, the LFS did not collect wage information until 2006. Second, the earnings information contained in the LFS since 2006 is obtained from administrative sources and refers to formal employees only. Admittedly, the self-reporting of earnings always poses challenges. However, addressing these challenges and obtaining earnings information for informal workers is important because the shadow economy is quite large. This unofficial segment of the economy represents about 20% of the Spanish GDP according to several sources and has been on the rise in recent years. It is therefore important to study working conditions of informal workers. Moreover, considering the labor earnings of self-employed workers (formal or not), who represent a non-negligible part of the labor force, is crucial to studying earnings inequality and its evolution more accurately.
Summary and policy advice
The findings presented in this article suggest numerous policy considerations, partly because Spain's chronic labor market issues became more evident in the aftermath of the Great Recession. Three consecutive labor market reforms were introduced between 2010 and 2012. However, significant challenges remain unsolved, such as the rigid system of collective bargaining, and the dual nature of employment protection legislation. Preliminary assessments suggest that while the reform enacted in 2012 has promoted firms’ internal flexibility, no reform has properly addressed the problem of duality, as the firing–cost gap between temporary and permanent contracts remains large [9]. This is exemplified by the fact that in 2018 the share of temporary employees still amounted to 26.8%. As a means for combating duality, 100 economists signed a manifesto defending the abolition of most temporary contracts and the introduction of a single open-ended contract for new hires with no ex-ante time limit and with severance payments smoothly increasing with seniority [10].
Importantly, previous reforms made very little progress toward the design, implementation, and evaluation of well-targeted active labor market policies that improve the employment prospects of vulnerable groups generally, and the long-term unemployed in particular [11]. Spain's levels of long- and very long-term unemployment are so unsustainably high that they pose a risk for social cohesion, and it is unlikely that growth alone will be enough to get many of the long-term unemployed back to work. Moreover, public employment services should give priority to the early activation of the unemployed in order to avoid their addition to the ranks of the long-term unemployed.
Acknowledgments
The authors thank anonymous referees and the IZA World of Labor editors for many helpful suggestions on earlier drafts. The authors also wish to thank Mario Izquierdo, Juan Francisco Jimeno, Julián Messina, and Núria Rodríguez-Planas for their helpful comments. Version 2 of the article updates the content and figures to 2018.
Competing interests
The IZA World of Labor project is committed to the IZA Code of Conduct. The authors declare to have observed the principles outlined in the code.
© Anna Sanz-de-Galdeano and Anastasia Terskaya