Elevator pitch
Being the largest economy in the Eurasian region, Russia's labor market affects economic performance and well-being in several former Soviet countries. Over the period 2000–2017, the Russian labor market survived several deep crises and underwent substantial structural changes. Major shocks were absorbed largely via wage adjustments, while aggregate employment and unemployment showed little sensitivity. Workers have paid the price for this rather stable employment situation in the form of volatile wages and a high risk of low pay.
Key findings
Pros
Employment has remained high, while unemployment has remained low.
Flexible wages help absorb economic shocks.
The education level of the workforce is high and keeps rising.
There is no evidence to date of job polarization caused by the erosion of middle-skilled jobs.
Earnings inequality has gradually declined.
Cons
Employment is becoming more heterogeneous, unstable, and insecure.
Earnings inequality is still high.
The country’s unemployed suffer from weak unemployment protection.
There is a high incidence of low-paying jobs and this situation has persisted over time.
The labor market may be at risk of over-education, with signs of declining educational premia appearing.
Author's main message
The Russian labor market has maintained high employment and low unemployment despite several major macroeconomic shocks. Ingrained institutional features slow aggregate employment change but impose few constraints on downward and upward wage movements. Robust aggregate performance hides some significant issues, such as low and unstable wages, high, though decreasing, earnings inequality, increasing instability of jobs and low aggregate productivity. The established institutional model has been instrumental in absorbing shocks but not conducive to economic growth and modernization.
Motivation
Russia has the largest population among all European countries and the largest territory in the world. Its GDP is the sixth largest by purchasing power parity (PPP) in the world, though this estimate is perhaps skewed somewhat because the economy has a heavy focus on mining and extraction. Due to its relative size, economic specialization, and historic legacies, the Russian labor market has a strong influence on its neighbors (especially in the Commonwealth of Independent States) through trade and migration as well as directly affecting the well-being of its own citizens.
In the 1990s, Russia went through a prolonged and painful transformational recession and experienced multiple and strong macroeconomic shocks. However, early forecasts of plummeting employment and skyrocketing unemployment did not come to fruition. The Russian labor market gradually adopted a non-standard mode of adjustment, with shocks accommodated largely by the price side (i.e. workers’ wages), rather than the quantity one (i.e. employment/unemployment). This model took root during the transformational period and has remained a salient feature of the Russian labor market during the subsequent decades.
Discussion of pros and cons
Labor market developments in Russia from 2000 to 2017 are difficult to understand without acknowledging what happened in the 1990s. During this turbulent decade, the Russian Federation emerged after the collapse of the USSR, and the painful transition from a planned to a market economy began. The country experienced a prolonged and very deep economic recession, being hit by three strong macroeconomic shocks (in 1992, 1994, and 1998), the latter of which came in August 1998 and was triggered by the Asian financial crisis. By that time the country's GDP was about 60% of that of 1991 (the USSR's final year of existence). However, the widely expected collapse of the labor market did not happen: employment fell by a “modest” 15%, while unemployment remained at moderate levels, particularly given the unprecedented depth of the recession. The unemployment rate reached its all-time peak level of 14% in 1999 but began to decrease shortly afterwards. The cost of adjustment was largely borne by real wages that dove deeply and, by the end of the decade, had lost two-thirds of their 1991 value. Persistently high inflation coupled with delayed wage payments (wage arrears) devalued employers’ labor costs [1], [2]. Additional adjustment mechanisms, such as administrative leaves, short-time working arrangements, and an expansion of informal employment helped to keep conventionally measured unemployment low and employment high.
Summing up the first decade of the Russian labor market story, it can be said that the relatively mild adjustment of employment and unemployment can be explained by extremely flexible real labor costs. This flexibility had a few key foundations: high inflation, wage arrears, low wage floors, and large variable fraction of pay [3], [4]. The recovery from the recession began in the early 2000s. The deep devaluation of the national currency resulting from the 1998 crisis and a fast oil\gas price recovery, which started somewhat later, changed the macroeconomic environment and helped Russia to ultimately return to the growth path, though it has not been an even one.
Aggregate issues: 2000–2017
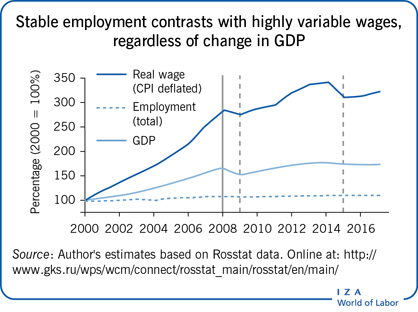
The aggregate performance of the Russian labor market since the turn of the century is shown in the Illustration. It presents the evolution of GDP, employment, and real wages in percentage terms compared to the reference year of 2000. The year 2008 divides the period under consideration into two sub-periods. The first was characterized by fast economic growth. The second is associated with a prolonged stagnation and two new crises, which occurred in 2009 and 2015.
As seen in the Illustration, aggregate employment showed almost no reaction to GDP change in either sub-period. It grew by a mere 9% compared to the 66% growth in GDP during the first sub-period and remained largely flat throughout the second one. The real-wage value rose by an impressive 185% during the first sub-period, while the second saw two non-trivial falls in the real wage with a fast recovery in-between. The GDP level in 2017 exceeded that of 2008 by a modest 5%. Again, real wages seem to work as a major equilibrating device to help keep employment stable.
Stable employment (and low unemployment) does not exclude the possibility of low participation and employment rates. In the Russian case, however, both stayed persistently high. The employment to population (e/p) ratio tended to climb gradually and monotonically despite the crises. Starting from a level of 63.3% (for those aged 15–64) in 2000, it reached 70.3% in 2017. The gender employment gap of around eight to ten percentage points remained steady during the whole period. With such ratios the Russian employment level is above the OECD average, and the female employment rate (about 65%) is among the highest in the world [5]. The gradual increase in the e/p ratio was associated with a growing demand for both younger and older workers (during the economic recovery) and a growing supply of college graduates (the group that enjoys the highest e/p ratio).
If the prime age group (aged 25–54) is observed, the e/p ratios for men and women (about 90% and 83%, respectively) are three and 14 percentage points higher than the OECD average. Meanwhile, female employment levels in Russia exceed those of males in some European countries (e.g. Southern Europe). Such high rates hold despite the country's rather early retirement age (55/60 years for women and men, respectively).
Stable employment might imply stable unemployment as well. Figure 1 shows the stylized unemployment story and presents how three major indicators have evolved.
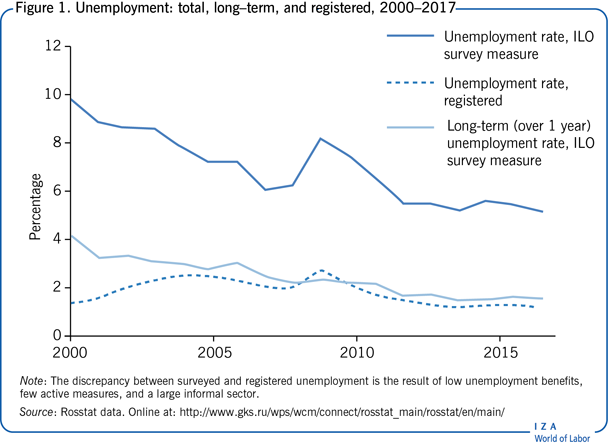
Both of the ILO surveyed unemployment rates tend to decline over the 17-year period. The 2009 shock caused a short-lived hike in the total unemployment rate (from 6% to 8%). After 2012, the unemployment rate of the labor force stayed permanently under 6%. Meanwhile, registered unemployment was always much lower than survey-based unemployment. This performance (low unemployment and a large disparity between survey and claimant unemployment rates) emerges as a salient feature of the Russian labor market and is due to the combination of miserable labor market policy (low unemployment benefits (UB) and almost non-existent active measures) and the relatively large informal sector. The long-term unemployment rate declined gradually as well during this period. It made up about 40% of total surveyed unemployment in the beginning of the period but only about 30% by the end.
As the above figures suggest, unemployment has not emerged as a hot labor market issue. Again, the main market reaction to significant macroeconomic volatility has passed through the price side, not the quantity one. This situation stands in contrast to those observed in Central and Eastern European countries, which also experienced the transition [6].
Institutional foundations of persistently stable employment and flexible wages
The puzzle of persistently stable aggregate employment and flexible wages can be explained by specific features of the Russian labor market institutions. The speed of employment adjustment, as proxied by hiring and firing rates, is largely affected by the stringency of employment protection legislation (EPL), whereas wage flexibility depends on the basic wage-setting machinery. The latter includes rules for fixing wage floors and collective bargaining procedures. The choice of a particular wage–employment trade-off is largely a political-economic problem, and the Russian government has always considered low unemployment among its top priorities in domestic politics.
Employment regulations
The core of Russian EPL is embodied in the existing Labor Code, which was first enacted in 2002. Although it did abolish some obsolete rules, the EPL portion of the Code reflected its predecessor, inheriting many rigidities from the Soviet-era legislation.
In the mid-2000s, the World Bank's Doing Business index rated the rigidity of employment (rigidity of hiring, firing, and working hours) for Russia as much more stringent compared to the OECD average [4]. The OECD tended to evaluate the Russian EPL as moderately flexible, even though it admitted excessive rigidity regarding workers with permanent contracts. According to the most recent estimates, job protection for Russia is assigned a higher score compared to the OECD average. Only Portugal, which is known for having the most strict EPL among all OECD member countries, has a higher score along this dimension [7].
Minimum wage and unemployment benefits
Over the whole period from 2000 to 2017, minimum wages and UBs were fixed at low levels. The minimum to average wage ratio (the Kaitz ratio) stayed below 10% until around 2007. In January of 2009, minimum wages nearly doubled (from Rbl 2,300 to Rbl 4,330 in nominal terms)—increasing from 13% to 23% of the average wage. However, soon after 2009 the Kaitz ratio dropped back down to 17% before rising to 20% by the end of 2017. Since the average wage in better performing regions was up to five times higher than in the worst performing regions, the national minimum wages in 2017 equaled a mere 15% of the average wage in wealthier regions (such as Moscow city or the oil-rich Tyumen region), while it could exceed 50% in poorer ones (the national republics of the North Caucasus, among others). During the entire period, this national ratio was much lower than in Central and Eastern Europe.
Until 2006, the minimum wage was set by the federal authorities uniformly for all regions. According to the 2006 amendments to the Labor Code, in addition to the national minimum wage, each region was allowed to introduce its own minimum wage at a level not lower than the national one. Some regions refrained from raising the regional minimum wage level, others raised it very modestly, while others increased it more substantially, but with significant caveats. One of the highest regional minimum wages was set in Moscow, though even here it only amounted to about 25% of the average wage.
The evolution of UBs over time tells a similar story. The replacement ratio (as the ratio of average UB to average wage) reached its peak level of 30% in 1998 before experiencing a gradual decline to below 10% by the 2008 crisis. An increase in the maximum UB value in 2009 did not impact the replacement ratio, and the latter continued its gradual downward slide. In 2017, it was only around 7–8%. In this context, the UB level has never served as a binding wage floor.
Low UBs are an outcome of very scarce spending on passive labor market programs (spending on active policies has likewise been negligible). Throughout the 1990s, these types of expenditures comprised less than 0.5% of GDP. In the 2000s, total annual spending on labor market programs was under 0.1% of GDP, and it only approached 0.3% in 2009 due to additional anti-crisis spending [3]. For comparison, spending on passive programs alone in OECD countries amounts to, on average, about 1% of GDP [8].
As can be seen, the wage floor has remained persistently low for various political and economic reasons and could hardly be viewed as an efficient barrier against declining wages. Looking a bit deeper into this situation, what factors could help explain the Russian government's commitment to a low wage floor policy? A few reasons can be mentioned. First, there were fiscal constraints. Until 2000, multiple social benefits were tied to the minimum wage and any increase in the latter incurred a knock-on effect that raised social spending. By the same token, any rise in the minimum wage would shift the entire pay scale in the public sector upward, thus also inflating total spending. Second, the enormous diversity of Russian regions implied that any large increase in the national minimum wage or UB could severely and negatively impact the most depressed regional labor markets. And third, while the government considered high unemployment as a politically dangerous challenge, the low wage floor (in combination with other institutional features) helped to absorb low-skilled labor and keep unemployment at bay. Upward adjustments to UB and minimum wage levels were implemented only when they were considered to be politically beneficial, and usually coincided with upcoming elections.
Wage setting and two-tier wage structure
Similarly to the situation with downward wage flexibility, upward wage flexibility in Russian firms was not constrained either. An individual wage—in both private and public firms—typically contains two components. The first part is fixed in labor contracts. The second is a highly variable part, comprising, on average, one-third of the total wage and is often dependent on the financial performance of the firm. (An informal component—i.e. under-the-table, or “envelope,” pay—if it exists, adds the third and the most flexible fraction for some types of employment.) In the public sector, albeit heavily regulated, the variable part is linked to revenues of regional/local budgets. If the latter increase, public sector workers enjoy higher earnings, other things being equal, and vice-versa [4]. The variable fraction correlates positively with the average wage across industries and firms.
The large and persistent variable component in the two-tier wage structure provides automatic risk-sharing in the face of high uncertainty. At the same time, it contributes to higher wage inequality.
Trade unions and wage agreements
Trade union density was close to 100% in the early 1990s but gradually eroded. In large- and medium-sized firms, about 70% of workers are still unionized. How many of these union members exist only on paper though remains unclear. Outside the segment of large- and medium-sized firms (which provide about 45% of all jobs), trade unions barely exist now at all.
Judging by conventional measures, wage setting in Russian firms looks highly centralized and coordinated with a multi-layer bargaining structure. The Tripartite Commission is a national-level body that adopts country-wide agreements. This is followed by industry-level agreements between employers’ associations and sector-specific trade unions, and finally by tripartite agreements at the regional level. Within this framework, firms might seem to be left with no room for decentralized wage adjustments. However, the variable fraction of the total wage usually remains contingent upon performance, which creates a spot market phenomenon and an inequality-enhancing component. This makes the entire collective bargaining structure largely shallow. Had trade unions been stronger and more influential, one would expect to see less variation in wages, a smaller variable part (if any) in the wage structure, lower quit rates, and a higher frequency of strikes across the economy compared to what was observed during the studied period.
Efficiency of employment protection enforcement
EPL enforcement varies significantly across Russian regions, localities, and firms, which translates into heterogeneous labor market performance [9]. Stricter enforcement raises labor costs, affecting employment negatively and unemployment positively, whereas weak enforcement serves to deregulate the labor market. The actual application of these rules in a given region is often modified by direct interventions from regional and local authorities into firms’ policies. The actual degree and nature of enforcement thus becomes unpredictable ex ante, thereby increasing uncertainty and raising de facto adjustment costs for any mass downsizings. As an outcome, employers tend to avoid large-scale layoffs, stimulating instead individual quits that incur zero firing costs. Flexible wages with large variable portions help induce such quitting in times of poor economic performance. This contributes to a slowing down of employment adjustments.
Education: Formal education is high, but labor productivity remains low
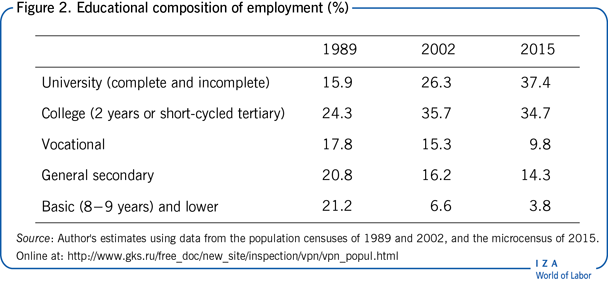
Two of the most salient features of the Russian labor market were the fast expansion of university-level education and, simultaneously, the gradual disappearance of the low-educated labor force. As Figure 2 shows, in 1989 (before the collapse of the USSR), one in six employed individuals had a university-level education, in 2002 the ratio was one in four, and in 2015 it was more than one in three. The total fraction of all tertiary education holders (including university and college) exceeded 70% in 2015. With this abundance of tertiary education holders, Russia finds itself ahead of most countries according to this indicator. However, given the existing job structure with a large proportion of low-skilled jobs, this has led to a growing overeducation problem. Meanwhile, the uneducated labor force has all but disappeared. Workers with nine or fewer years of schooling comprise less than 4% of total employment and are mostly close to retirement or of retirement age.
Despite this dramatic increase in educated workers and decrease in low-skilled laborers, the overall level of skills mismatch in the economy remained fairly stable between 2000 and 2017. Three key indicators help tell the tale: first, and expectedly, a higher level of education is associated with higher employment rates. The e/p ratios for university graduates exceeded 80% over the whole period, and the ratios for holders of college degrees and vocational certificates also remained high. The latter reached 76% by the midpoint of the period, with a gradual decline to 71% by the end. Meanwhile, workers with secondary and lower levels of education faced shrinking employment opportunities, partially influenced by the interaction of low skills and old age.
Second, the return to one year of schooling, estimated using the standard Mincerian equation, rose steadily starting at 2–3% in the early 1990s to its peak level of 8–9% by the mid-2000s. It then declined gradually to 7–8% by the end of the period. These estimates, though lower than the average for high-income countries (about 10% per year), are within the range for transitional Europe and the Central Asia region [10]. However, they can hardly be considered low, given the booming supply of educated labor against the background of a stagnating economy.
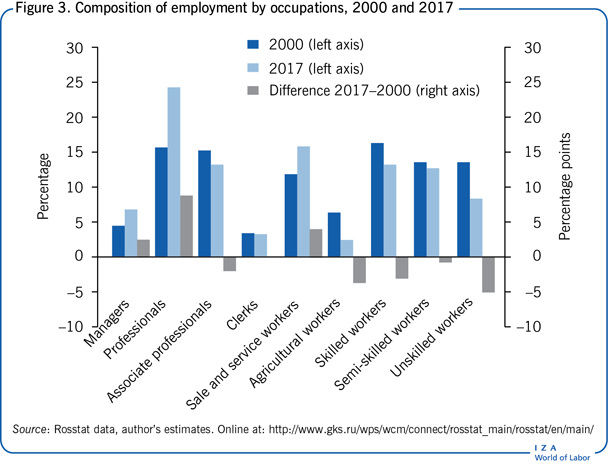
The third key indicator involves an examination of the reallocation of labor across major occupational groups. Figure 3 compares occupational compositions of employment at the one-digit level in 2000 and 2017, and presents its change. In sum, the most skilled occupations (managers, professionals, and associate professionals) gained over nine percentage points, while the share of low-skilled occupations tended to decrease. This demonstrates that the increase in the supply of educated labor was largely met with growing demand and, therefore, does not support the polarization hypothesis. However, this issue deserves closer scrutiny, and job polarization, including mass overeducation, cannot be excluded as a plausible outcome in the mid-term future.
Wage and earnings inequality
Dynamics and levels
The evolution of monthly real wages (CPI deflated) can be seen in the Illustration. Although its trajectory shows large ups and downs during the period, in 2017 the real wage reached 323% of its 2000 level. The monthly growth in nominal dollar terms was even more impressive, though it was very unstable over time. Starting from $80 in 2000, the monthly wage reached $700 in 2008; it then lost over $100 in 2009, exceeded $900 by 2013, and finally ended up at about $550 in 2017. Major losses occurred in times of crisis and were aggravated by deep devaluations of the national currency.
Simple calculations using Russian Federal State Statistics Service (Rosstat) corporate wage data and employment weights for the corporate (61% in 2017) and non-corporate (39% in 2017) sectors suggest that monthly labor income in the non-corporate sector equals about 70% of that in the corporate sector. This corporate–non-corporate wage gap has increased over time, and the concurrent expansion in non-corporate employment could help explain the nation-wide increase in low pay and inequality.
The Illustration could be seen as suggesting that wage growth significantly outstripped GDP and productivity growth, thereby undermining competitiveness. This conclusion, however, would be premature, since it ignores the divergence of price deflators applied to nominal wage values and GDP/productivity. If the GDP or PPI deflators are applied to wage costs to allow for more valid comparisons between the two, real wage and productivity trends appear much closer and, from 2009 onward, barely diverge.
Low pay
High employment and low unemployment rates in the presence of low wage floors and almost unconstrained wage flexibility are associated with a massive array of low-paid jobs. Instead of more generous unemployment protection, the Russian labor market relies on keeping workers in low-paid employment, and thus low pay substitutes for open unemployment.
The fraction of low-paid jobs (workers are conventionally considered low-paid if their hourly earnings are below two-thirds of the median earnings) was always large, although it has declined over time. One recent study shows that the size of the low-paid group decreased from 30% in 2002 to 24% of total employment in 2016 [11]. These rates are markedly higher than the average for EU countries (17%) but are close to the rates in Latvia, Lithuania, and Romania. The chances of being low-paid are significantly higher for workers with lower levels of education and skills and for those residing outside large cities. Controlling for unobserved heterogeneity and accounting for the initial conditions problem, the same study concludes that being in the low-paid state is predominantly a long-term trap [11]. The authors demonstrate a high degree of structural dependence with two out of three low-paid workers unable to exit from this state within a year. Additionally, the trap effect appears stronger for women than for men.
Inequality
The high incidence of low pay as well as the widespread use of performance-related wage setting contributes to wage inequality. Using the 2013 October wage survey that covers workers in major industries (excluding agriculture, finance public administration, and all small businesses), a 2016 study estimates Gini coefficients (a common measure of inequality with 1 referring to complete inequality and 0 referring to perfect equality) separately for the fixed and variable wage components [12]. The Gini value for the variable part was as high as 0.63, while it was “only” 0.40 for the fixed part. Higher industry average wages correlated positively with the size of the variable wage fraction.
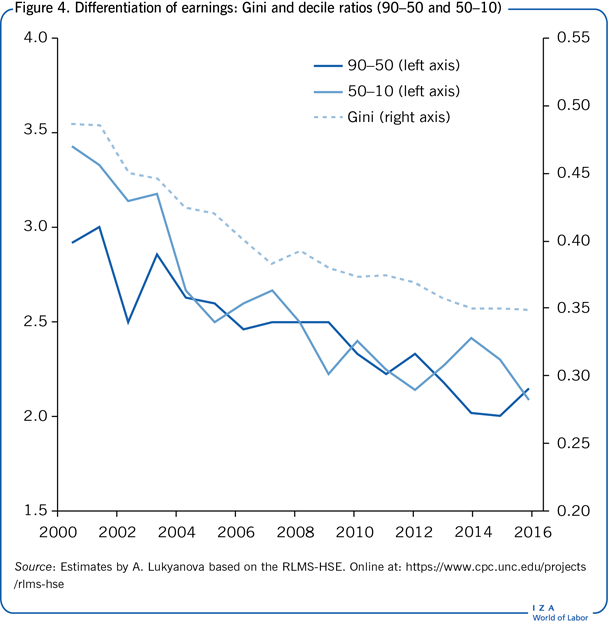
Figure 4 presents the evolution of earnings inequality by using Gini and decile ratios (90–50 and 50–10). These indicators suggest that inequality trended downward throughout the whole period. Rosstat provides much higher Gini estimates but with the same declining trend: from 0.50 in 2000 to 0.41 in 2017 [13]. The difference may be due to the fact that Rosstat, using data from surveys of firms, does a somewhat better job of capturing the right tail (higher earnings) of the distribution than does the Russian Longitudinal Monitoring Survey (RLMS-HSE). Either way, the decline in inequality during the period is considered an established fact [14].
What could drive this apparent compression? The literature does not suggest a conclusive answer. Interestingly, the fastest pace of inequality reduction was observed from 2000 to 2005, before the commodity boom took off (in 2004) and before the minimum wage was raised substantially (in 2007 and again in 2009). A tentative explanation is that the quick post-crisis (1998) recovery benefited low wage earners first through relatively fast elimination of accumulated wage arrears and the contraction of short-time work arrangements and unpaid leaves. These non-standard wage adjustment practices affected low-paid workers relatively more frequently [2]. In searching for additional explanations, one can link decreasing inequality measures to the inter-industry reallocation of labor. Over the period (and especially within its first years), the lowest paying (agriculture and the public sector) and the highest paying (finance and mining) industries contracted their employment dramatically and their average wages converged toward the mean [14].
Limitations and gaps
Most of the available knowledge of the Russian labor market comes from one source—the RLMS-HSE, which was initiated in 1994. Even though it is nationally representative and contains a wide spectrum of questions, it has limited size and focuses on the supply side only. Data on the demand side of the market are much scarcer. Moreover, there is a shortage of high-quality microdata on wages and firms. Rosstat routinely reports aggregate average wages for the economy at large as well as breakdowns by regions and industries. These estimates, however, are severely biased, since almost 40% of total employment is not covered by these statistics. Unfortunately, the standard labor force survey administered by Rosstat does not allow for wage measurements. Representative surveys of household incomes that include wage questions were first launched by Rosstat in 2015, but labor market related questions remain scarce.
Summary and policy advice
The Russian labor market has developed a set of complementary institutional arrangements that have survived multiple crises since the early 1990s. The strength of this model lies in highly flexible wages, while its weakness can be found in the low sensitivity of employment. This combination helps buffer various shocks without hiking unemployment, but it is not well-suited to coping with competitive pressures, and it generates income volatility and high inequality. A 2013 study provides some background by arguing that this “model was the best available in the given circumstances of the deep recession, macroeconomic and political uncertainty, and weak institutional environment. The choice of this particular model was highly path dependent at all stages of the transition period” [4], p. 719.
Whether this model needs to be dismantled or radically reformed remains an open question. In any case, moving simultaneously along a metaphorical two-lane highway would seem to be the right strategy. On the one hand, labor market regulations should be simplified, become more transparent and less costly for both firms and workers. On the other hand, the enforcement of laws and contracts should be radically improved. However, major constraints on job creation, productivity growth, and more efficient use of human capital lie outside the labor market per se and have a deep political-economic origin.
Acknowledgments
The author thanks anonymous referees and the IZA World of Labor editors for many helpful suggestions on earlier drafts. The author is grateful to Hartmut Lehmann for useful comments and to Anna Lukyanova for providing the estimates of inequality. Previous work of the author contains a larger number of background references for the material presented here and has been used intensively in all major parts of this article [4]. Financial support within the framework of the HSE University Basic Research Program and from the Russian Academic Excellence Project “5–100” is gratefully acknowledged.
Competing interests
The IZA World of Labor project is committed to the IZA Code of Conduct. The author declares to have observed the principles outlined in the code.
© Vladimir Gimpelson