Elevator pitch
New Zealand is a small open economy, with large international labor flows and skilled immigrants. Since 2000, employment growth has kept pace with strong migration-related population growth. While overall employment rates have remained relatively stable, they have increased substantially for older workers. In contrast, younger workers as well as the Maori and Pasifika ethnic groups experienced a sharp decline in employment rates and a rise in unemployment around the time of the global financial crisis. Wage gains have been modest and there has been a compression of earnings differentials by gender as well as by skill.
Key findings
Pros
Total employment has grown substantially, though a concurrently increasing population means that the employment rate has remained relatively steady.
Employment rates for older workers have risen substantially.
The gender wage gap has declined.
The proportion of employed workers with tertiary qualifications has increased substantially.
Lower job turnover rates indicate greater stability for employed workers.
Cons
Unemployment is still above its pre-crisis level, and long-term (six months or more) unemployment remains high at 33%.
Young workers as well as Maori and Pasifika ethnic groups continue to face higher than average unemployment rates.
Wage inequality has risen somewhat in the upper half of the wage distribution.
The tertiary earnings premium has declined, and high-level tertiary qualifications (Master’s and above) are under-represented.
Reduced job turnover indicates less labor market liquidity, reducing the scope for reallocation.
Author's main message
New Zealand entered an economic downturn in the first quarter of 2008, which was prolonged by the global financial crisis later that year. The labor market recovery was slow until 2013, when net immigration, employment growth, and unemployment declines all picked up. Labor market liquidity has remained low since the 2008 downturn, with rates of job starts, job ends, job creation, and job destruction all still below pre-2008 levels. Overall earnings growth has been modest, though slightly faster for women, leading to a narrowing of the gender wage gap; however, the gap remains significant for women aged 30 and over. Falling wage premiums for tertiary education and growing skill mismatch highlight the challenges of keeping education provision aligned with the labor market.
Motivation
Changes in the New Zealand labor market since 2000 reflect longer-term forces that are instructive for all societies. These include a shift from agricultural and goods-producing industries toward service industries, increasing participation of older workers and women, and rising levels of educational attainment. The share of employed people with tertiary qualifications has increased while the associated premium on earnings has decreased. New Zealand’s relatively high degree of reported skill mismatch also makes its labor market generally interesting. The New Zealand experience highlights issues of broader relevance about skills in the labor market. In particular, it raises questions about the contribution of specialized skills in a small open economy with many small firms.
Discussion of pros and cons
Employment and population changes
As in many countries, the global financial crisis (GFC) has had a significant influence on New Zealand’s labor market. As shown in Figure 1, New Zealand entered recession at the beginning of 2008, slightly before the GFC struck [1]. GDP declined until mid-2009. Employment growth ended in the first quarter of 2009, five quarters after output peaked in the fourth quarter of 2007. This brought to an end a decade-long period of sustained employment growth that had increased the number of people employed by 26%. Over the following five quarters, employment declined by 1.8%, returning to its 2007 level by mid-2011. It was a further two years before the pace of annual employment growth rose above 1%.
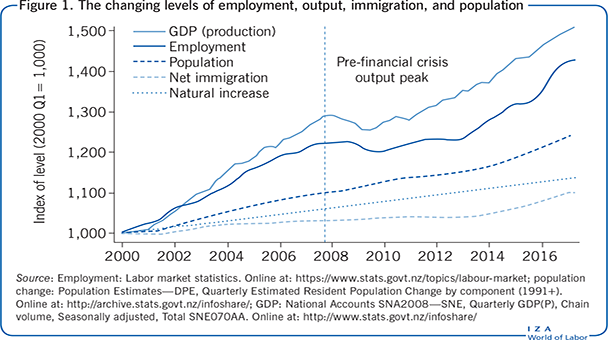
From early 2010 to early 2013, employment grew by 2.7%—more slowly than the 6.3% growth in output, yielding a brief rise in labor productivity. Employment grew at roughly the same rate as the population over this period. The acceleration of employment growth starting in 2013 coincided with a pickup in the net immigration rate, reflecting an increase in international immigrants, as well as a net gain of returning New Zealanders. Although natural increase contributed more overall to population growth than net immigration between 2000 and 2017, the latter has dominated population growth since 2014, as it did in 2002 and 2003. Due to New Zealand’s skill-focused immigration policies, net immigration has served to raise the country’s average level of skills.
Figure 1 summarizes the patterns of population and employment growth, with the post-GFC employment decline and post-2013 acceleration in employment growth clearly evident. This contrasts with the relatively steady output growth since 2010. The figure also highlights the increase in net immigration and consequent population growth after 2013. The growth in the working-age population (aged 15 years and over) between 2000 and 2017 was 29%, slightly higher than the overall population growth (24%).
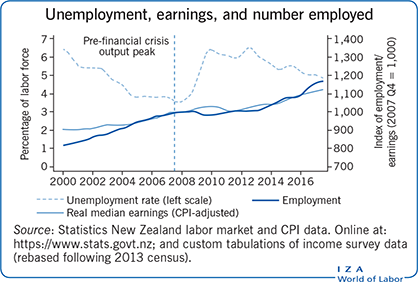
Because employment growth was accompanied by growth in the working-age population, the employment rate (measured as the proportion of the working-age population that is employed) recovered more slowly than overall employment. In fact, it was not until 2016 that the employment rate recovered to its pre-GFC level of 66%.
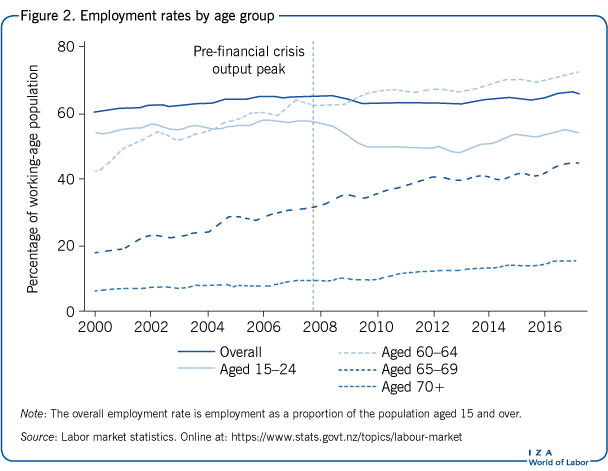
The overall changes in employment rates conceal some very different patterns across demographic groups. Figure 2 highlights some of the main differences. Young people (aged 15?24) were particularly hard hit by the post-GFC contraction, experiencing an eight percentage point employment rate decline from a pre-GFC level of 58%—a level that had not been reached again by 2017. In contrast, the trend of rising employment rates for older workers continued throughout the 2000 to 2017 period. The employment rate of 60?64 year olds rose from 42% in 2000 to 74% in 2017. At age 65, New Zealanders are eligible for a universal, non-means-tested pension (“NZ Superannuation”), but the strong rise in employment rates is evident even for workers above this age. Employment rates for 65?69 year olds rose from 16% to 44%, and for workers over the age of 70, from 4% to 13%. The employment patterns for older workers will have an increasingly strong impact on the labor market as population aging continues. The share of the population aged 65 and over is projected to nearly double over the next 50 years, from 15% to 28%.
The pattern of men’s and women’s employment rate changes was similar to that of the overall employment rate, declining around the onset of the GFC and slowly rising since then. The initial decline was, however, more pronounced and more immediate for men than for women, reflecting men’s greater prevalence in declining industries and occupations. The employment rate for women regained its pre-GFC level of 60% by late 2014, whereas the employment rate for men has not yet reached its pre-GFC level of 73%. In the latest quarter for which data are available (second quarter of 2017), the employment rate for men was 72.5%, still 11.1 percentage points above the rate for women (61.4%). Because men were more adversely affected by the GFC, the gender gap in employment rates has declined from a pre-GFC level of around 14 percentage points.
Against the background of obvious cyclical fluctuations, longer-term trends continue to shape New Zealand’s labor market, including a shift to services. Based on OECD statistics, the share of employment accounted for by service industries grew between 2000 and 2015, from 68.0% to 71.8%. In contrast, the primary-industry share (in farming, forestry, fishing, and mining) dropped from 8.7% to 6.4%—which is still relatively high for a high-income economy. The remaining share, in goods-producing industries, dropped from 23.4% to 21.9%. This decline occurred despite an approximate doubling in construction employment associated with rebuilding after the 2011 Christchurch earthquake and a pickup in construction in Auckland in response to population growth. The number of manufacturing jobs declined between 2000 and 2015 by around 10%, with almost all of this drop occurring in 2008 and 2009.
Unemployment changes
The sustained impact of the GFC is also evident in unemployment rates, as shown in Figure 3, although unemployment has remained relatively low by international standards, peaking at 6.5% in 2012. By 2017 the rate had fallen to 4.8%—still above the pre-GFC level of 3.5%. Long-term unemployment has also remained relatively high. Accordingly, the proportion of the unemployed who had been unemployed for at least six months rose from 13% in 2007 to 33% in 2017—a level last seen in 2000. For young people, the unemployment rate rose to 17.5% by the end of 2009 and has not dropped below 12.5% since then.
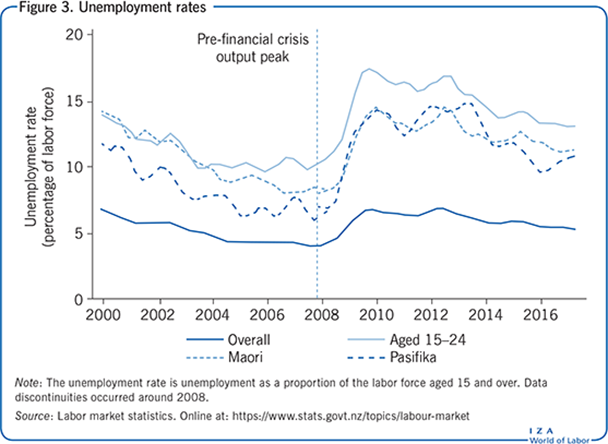
Sharp and sustained increases in unemployment were also experienced by Maori and Pasifika—groups with historically higher than average unemployment rates, related in part to their relative youthfulness and lower average qualifications. Data discontinuities that occurred around 2008 make comparisons with pre-GFC rates imprecise, but it appears that for both Maori and Pasifika, the unemployment rate roughly doubled after the crisis, peaking at almost 15% before dropping slowly to the current level of 10?11%. Both groups also experienced declines in participation rates due to the crisis, though Maori participation is now at historically high levels, at close to 70%—three percentage points higher than it was in 2007. Maori account for about 13% of the labor force, whereas Pasifika account for roughly 6%.
Changing labor market dynamics
The GFC clearly had relatively long-lived effects on employment, participation, and employment rates overall, as well as for particular subgroups. The post-GFC labor market also differs in terms of job and worker flows. In recent years, there have been consistently lower rates of job starts and job ends than prior to the GFC. As illustrated in Figure 4, the trend rate of job starts each quarter was close to 18% of employment prior to the GFC. This dropped to below 14% in 2009, and despite recovering somewhat, remains between 15% and 16%, even though the labor market has absorbed record high levels of immigration. Perhaps more surprisingly, the rate of job ends also declined markedly after the onset of the GFC, presumably reflecting a decline in voluntary quits that more than offset a rise in involuntary separations. Although the drop was not as sharp as for job starts, dropping by about three percentage points, the job end rate also remains below its pre-GFC levels. Lower rates of worker turnover reflect greater stability of employment for employees, but may also signal reduced flexibility in the labor market, with less reallocation of workers to more productive or better-matched jobs.
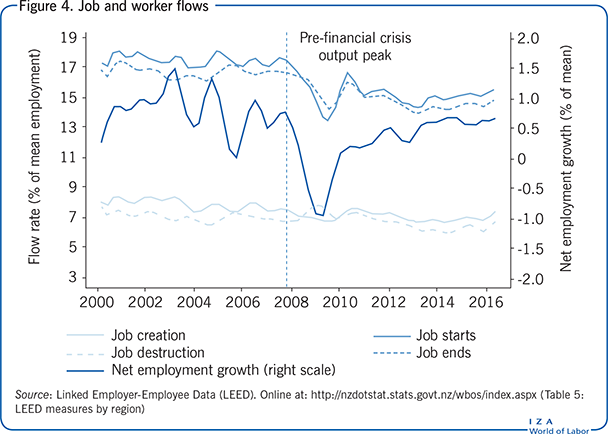
The changes in job creation and destruction rates also indicate a decline in labor market liquidity and reallocation. The job creation rate, arising from additional jobs in expanding firms, has remained lower than it was pre-GFC. The job destruction rate, arising from employment reductions in contracting firms, is also lower, after an initial spike in 2009. The modest rate of employment growth since 2010 is thus occurring despite a lower rate of new job creation or new hires. It remains to be seen whether the apparent rise in job and worker flows in the latest quarter is a temporary or sustained change.
Wage developments
There has been subdued growth in real wages since 2000, amounting to an increase of 24% until 2017, or about 1.3% per year. The pattern of growth in real (adjusted by the Consumer Price Index) median hourly earnings is shown in Figure 5 together with indicators of earnings dispersion. The increase in dispersion was concentrated in the upper half of the wage distribution. The 90th percentile of the wage distribution in 2014 was 1.9 times higher than the median, up from 1.7 in 2000, whereas the ratio of the median to the 10th percentile changed very little over the same period. Overall, the 90/10 wage ratio increased from 2.6 to 3.0, a modest rise by international standards.
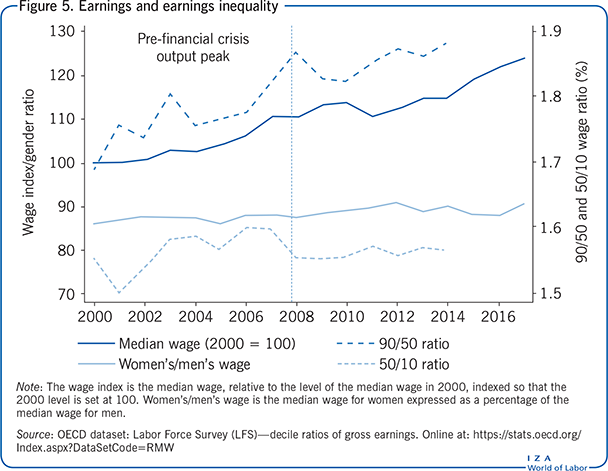
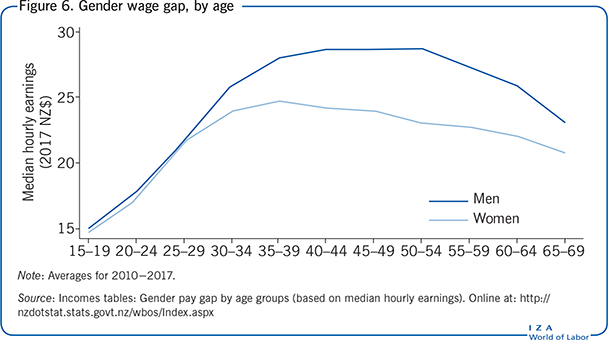
The gender wage gap has declined slightly since 2000. Median hourly earnings for women were 86% that of men in 2000, rising to almost 91% by 2017. The gains for women were concentrated in the downturn between 2009 and 2012, when men experienced slower wage growth, including a larger real decline than women in 2011. The gender gap remains high, however, for older workers. As shown in Figure 6, the gap is close to zero up until about age 30, and increases until ages 50?54, when median earnings for women are just over 80% of men’s. Beyond the age of 54, the median wage for men declines more rapidly than for women, compressing the gender wage gap.
Underpinning the overall growth in wages was a rise in average capital per worker, as well as improvements in labor quality. Aggregate productivity statistics suggest that about two-thirds of the 10% growth in labor productivity since 2000 has been due to a rise in the amount of capital per worker—most of which occurred between 2000 and 2010. The rise in worker qualifications was also significant. Between 2000 and 2017, the proportion of employed workers with university degree qualifications (ISCED level 5A and 6) rose substantially—from 13% to 33% of employment. In contrast, those with no qualifications accounted for only 12% of employment in 2017, compared with 20% in 2000. The changes in employment shares continue the process of qualification upgrading that has been evident for several decades. Census data from 1986, which are indicative but not completely comparable with the figures given above, show the share of workers with degrees at around 8% and the share of employed people with no qualifications at around 37%.
Figure 7 summarizes the joint evolution of employment shares and wage levels for three broad qualification groups. Although New Zealand’s growth in qualifications has been strong, tertiary qualifications in New Zealand include an unusually high proportion of short-cycle (two- to three-year) tertiary qualifications, and a low share of qualifications at Master’s level and above [2]. The number of tertiary qualified people among the 25- to 34-year-old population is also low compared with other countries.
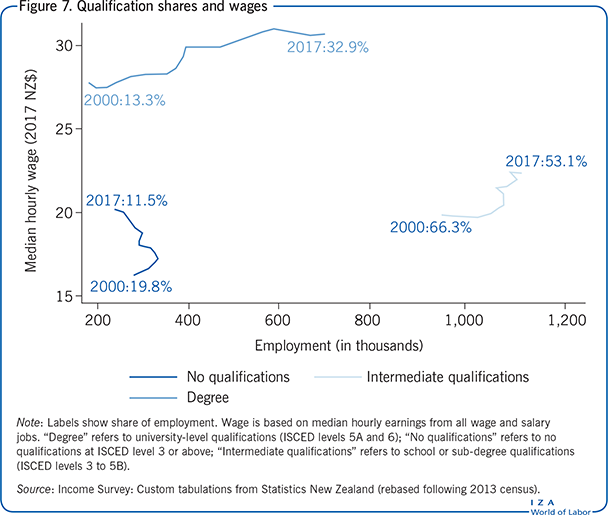
Furthermore, educational wage premiums are relatively low in New Zealand. The median hourly wage for degree-qualified workers was NZ$30.60 in 2017, 52% above the median for workers with no qualifications (NZ$20.14). This premium has declined since 2000, when it stood at 73%. Between 2000 and 2017, the wage increase for degree holders (10.5%) was smaller than that of unqualified workers (25.6%), and was also lower than that of workers with intermediate (ISCED level 3 to 5B) levels of qualification (12.5%). The erosion of the skill premium is perhaps unsurprising given the strong growth in the number of employed degree-holders, although the same erosion is not always evident in countries that have experienced similar growth in the relative supply of skilled workers. Movements in median earnings may also understate the skill premium facing any particular worker. The change in median earnings for more highly qualified workers will be lowered by the entry of less-experienced workers earning less than the previous median.
Regional labor markets
Not all regions within New Zealand have followed the national pattern of labor market changes. Two regions in particular have had notably different experiences—Auckland and Canterbury. Auckland is the largest city in New Zealand, accounting for around one-third of the national population. It attracts a disproportionate share of international immigrants, and also has higher rates of natural increase than other regions. Employment growth in Auckland was faster than average prior to the 2008 downturn. Despite experiencing a relatively large and long drop in employment between late 2008 and mid-2010, it has subsequently rebounded, and has had stronger than average growth between 2007 and 2017.
In contrast, the labor market in the Canterbury region was profoundly affected by the major earthquakes that hit the city of Christchurch in September 2010 and February 2011. Employment in this region declined by 5.5% in 2011. Growth has been strong since then, although it was not until mid-2013 that Canterbury regained its pre-earthquake level of employment. There has been particularly strong employment growth in the construction sector, related to the ongoing rebuild. This has put pressure on the demand for tradespeople throughout the country, especially in Auckland where there are efforts to increase housing supply in response to recent and expected population growth.
Limitations and gaps
The main limitation in this analysis is the coarseness of the disaggregation of data, which doubtless masks significant heterogeneity. More detailed investigation of the patterns is limited by the lack of consistent time series for key labor market statistics. Additionally, changes in the classifications of qualifications, ethnicity, and industry in official statistics during the 2000–2017 period restrict the level of detail. Finally, there is also limited publicly available data on wage inequality.
Summary and policy advice
In the face of changing technologies, jobs, and skill needs, educational policy remains a key challenge. The decline in the earnings premium for skills and the low average level of tertiary qualifications in New Zealand suggest that further refinements in education and immigration policies may be called for. Moreover, New Zealand has a high level of skill mismatch, which raises questions about the appropriate level and mix of qualifications [2]. With around one-third of New Zealand workers employed in firms with fewer than 10 employees, the value of advanced specialized skills may be less pronounced than in other countries. Shorter-term factors such as the growth in construction activity in Christchurch and Auckland may have also raised the relative demand for workers with sub-degree qualifications.
Promoting equity in the labor market is another enduring policy challenge, and one that evokes much debate. Addressing the causes and consequences of ethnic differences in educational outcomes, employment, and earnings remains an important policy issue. In recent years, there has been a heightened focus on gender pay equity, and influential settlements of pay equity claims. In 2017, the government agreed to increase the wages of around 55,000 care workers, mostly women, in the aged residential care, home support, and disability service sectors; it also reached a settlement in response to a pay equity claim for midwives, and has entered pay equity negotiations for teacher aides and school support staff. The current New Zealand government was elected in September 2017 with explicit commitments to introduce new pay equity legislation designed to make it easier to bring such pay equity claims. The new government is also committed to raising the minimum wage to $16.50 in April 2018 (68% of the June 2017 median hourly wage), and has signaled policies to make tertiary study more attractive—removing student fees and raising student allowances. The impacts of these policies should be carefully monitored over the coming years.
Acknowledgments
The author thanks Dean Hyslop and the IZA World of Labor editors for many helpful suggestions on earlier drafts.
Competing interests
The IZA World of Labor project is committed to the IZA Guiding Principles of Research Integrity. The author declares to have observed these principles.
© David C. Maré