Elevator pitch
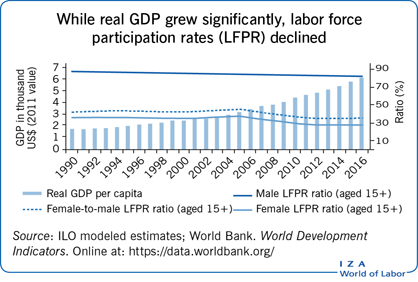
The Indian economy entered an ongoing process of trade liberalization, domestic deregulation, and privatization of public sector units in 1991. Since then, per capita output has increased significantly, while the overall unemployment rate has remained low. However, labor force participation rates have fallen sharply, especially for women. In addition, youth unemployment remains stubbornly high, an overwhelming proportion of the labor force continues to work in the informal sector, and there is little evidence of a sustained rise in wages for either unskilled rural or factory workers.
Key findings
Pros
At present, real GDP per capita and real GDP per person employed are both about 3.5 times their respective 1991 levels.
The overall unemployment rate has remained essentially below 5% since 1991.
Average labor productivity in organized manufacturing is now almost three times higher than in 1990.
After a period of stagnation, unskilled rural wages increased by around 35% in the period 2007–2013; wages also rose in the organized manufacturing sector, though to a much lesser extent.
Cons
For young workers (aged 15–24), unemployment has remained steady at around 10%.
Since 2005, the labor force participation rate has fallen sharply for both women and younger men; the female participation rate fell relative to the male rate by around ten percentage points.
Labor productivity in agriculture and related sectors has fallen to about 30% of the economy-wide average, even as almost half the labor force remains in these sectors.
Over 90% of the labor force continues to be in the informal sector, with no job security or protective labor legislation.
Author's main message
The Indian economy has performed well in terms of GDP growth and increases in output per worker over the last 25 years. There has been significant structural change during this time, with the importance of agriculture relative to total output falling sharply. While the aggregate unemployment rate has remained low, this is associated with a large fall in labor participation among women and young men. Employment continues to be overwhelmingly informal in nature, without security, income stability or the benefit of protective legislation. Major reforms are needed in a host of areas before India’s most pressing labor-related issues can be addressed.
Motivation
Knowing the facts about a labor market is crucial for understanding labor market policy. Equally important is knowing which areas of a country’s labor market are doing well and which ones poorly. India, having the largest labor market in the non-centrally planned world, is an especially important example.
Discussion of pros and cons
Aggregate issues: Growth, unemployment, and labor participation
In 1991, the Indian economy entered a period of extensive trade liberalization, substantial domestic deregulation, and limited privatization of the public sector. As shown in Figure 1, over the next quarter of a century, real GDP grew at a compound annual rate of over 5.5%, a significant improvement. Progress was particularly impressive during 2003 to 2010, when India achieved growth rates above 7.8% in seven out of those eight years. Growth rates fell somewhat from 2011 to 2016, but nonetheless remained within an impressive 6–8% range. As a consequence, India improved its global GDP rank in purchasing power parity (PPP) terms from eighth in the early 1990s to its current rank of third by 2010, and its share of global GDP PPP increased from about 3% in 1990 to almost 7.5% in 2016.
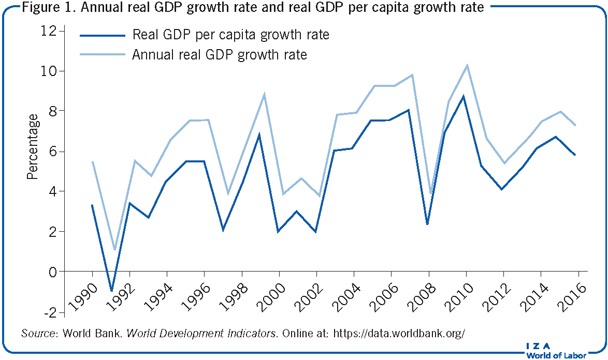
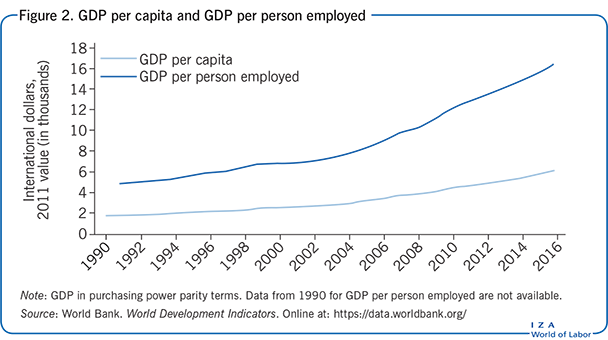
Figure 2 illustrates changes in per capita GDP and labor productivity, in the sense of output per person in the labor force. Per capita real GDP in PPP terms in 2011 international dollars was about $6,000 in 2016, about 3.5 times its 1991 value of roughly $1,700. The increase was about 50% in 1991–2001, almost 80% over the subsequent decade of 2001–2011, and about 30% over the next half decade. Labor productivity increased practically in tandem. GDP PPP per person employed in 2016 was about 3.4 times that in 1991. The increase in labor productivity was about 44% in the first decade, about 84% in the subsequent decade, and about 30% over the half decade thereafter.
The fact that labor productivity increased more or less in proportion to the increase in per capita output immediately suggests a limited impact of growth on employment. Figure 3 plots the behavior of unemployment over this period. Aggregate unemployment rates for people aged 15 years or older remained relatively low at around 4%, with female unemployment somewhat higher than male unemployment. However, youth (aged 15–24) unemployment rates remained in the 8–10% range between 1991 and 2010. As the growth rate fell slightly in recent years, the unemployment rate for young men has moved up to around 10%, while for young women it has moved up to 10–12%. Youth unemployment rates are significantly higher in urban areas: in 2011–2012, the urban youth unemployment rate reached a maximum of 18.8% for women aged 20–24 and 12.8% for men aged 15–19. By comparison, the unemployment rate for rural youth peaked at 6.3% for women aged 20–24 and 8.9% for men aged 15–19 [1].
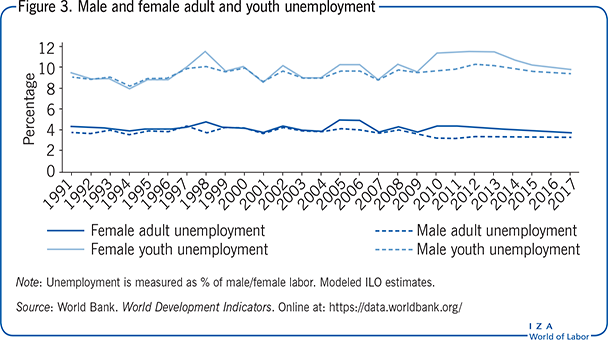
Figure 4 illustrates the behavior of labor participation rates. Strikingly, after staying more or less stable within a low 34–37% range from 1990 to 2005, the female labor participation rate started declining in a sharp, secular fashion, so that by 2012 it had fallen ten percentage points to about 27%. The female rate has remained stable at 27% thereafter. The male labor participation rate fell over this period as well, but much more modestly, from about 85% in 1991 to about 83% in 2005 and thereafter to about 79% in 2013, where it has remained relatively stable since then. Thus, while the number of female workers amounted to 41–45% of male workers during 1991–2005, this ratio had fallen to about a third by 2012, and has since stayed at that level.
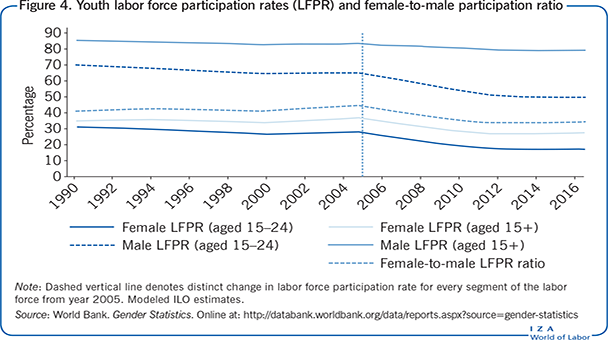
India has the world’s largest youth population, with 27% of the population aged between 15 and 29. It is therefore interesting that the post-2005 fall in participation rates appears even more marked for young people (aged 15–24 years). After fluctuating in the 28–31% range during 1991–2005, the participation rate of young women collapsed, finally stabilizing at about 17% after 2012. The participation rate of young men declined gradually from 69% in 1991 to 65% in 2005, and then much more sharply before stabilizing at about 50% after 2012.
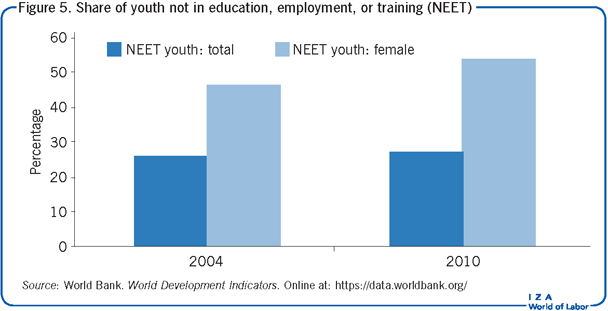
The share of youth not in education, employment, or training (NEET) increased marginally from about 26% in 2004 to 27% in 2010 overall. It appears that a large part of the decline in labor force participation by young men from 2005 to 2012 was matched by a commensurate increase in their presence in education and training. However, this does not appear to have been the case for young women, as their NEET rate increased from 46% to 54% (Figure 5). Looking deeper into the data, women’s labor force participation declined the most among the poorest households, whereas it actually increased among better-off households. Similarly, by levels of education, women’s participation declined among the illiterate and the least educated, but increased among those with higher levels of education. One possible interpretation is that women who had earlier been forced to take on the worst-paid, lowest-quality jobs because of poverty have withdrawn from those jobs as their overall household incomes have risen [2].
Changes in sectoral composition of employment
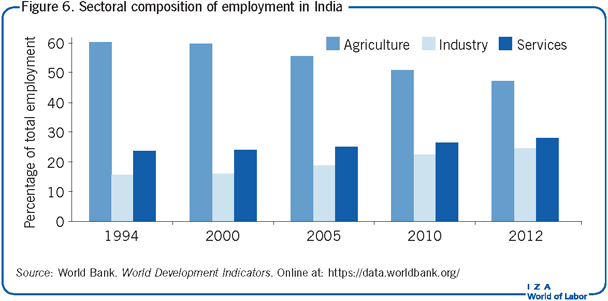
As a largely rural society, agriculture and related activities constitute the main source of employment for India’s workforce. In 1951, soon after independence, this sector absorbed about 72% of India’s labor force, while the industrial sector (mining, manufacturing, construction, gas, electricity, and water supply) employed about 11%. The service sector absorbed the remaining 17%. The GDP shares were 51%, 19%, and 30% respectively. Thus, agriculture was the biggest employer as well as the largest contributor to GDP. This employment structure changed quite slowly over the next four decades, so that by 1994, agriculture accounted for about 60% of the labor force, services for about 24%, and the industrial sector for about 16% (Figure 6). The corresponding GDP shares were 28%, 45%, and 27% respectively. Hence, while the agricultural sector remained the predominant employer, the service sector had supplanted it as the biggest contributor to GDP, while industry’s contribution to GDP was about the same as that of agriculture. However, by 2012, agriculture employed less than half (about 47%) of the labor force, while industry absorbed a quarter, and services almost 30%. The corresponding GDP shares were 14%, 27%, and 59% respectively.
Output per person employed in the agricultural sector amounted to about 70% of the total economy’s average output per person in 1951. This proportion had fallen to 47% by 1994 and 30% by 2012. Output per person employed in industry fell only slightly from 173% of the economy’s average in 1951 to about 169% in 1994, and then steeply to about 108% in 2012. For services, the change was from 176% in 1951 to 188% in 1994 and 211% in 2012. It follows that, while there was indeed a significant (almost 15 percentage point) transfer of labor away from the agricultural sector, this transfer was insufficient to compensate for the relative stagnation of agricultural output in the post-1991 period, leading to a sharp relative immiserization of those trapped in that sector.
The status of work in India
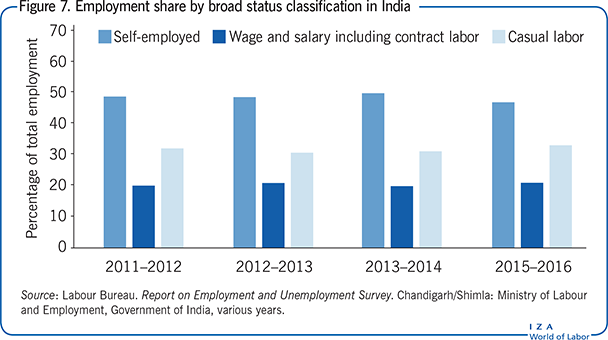
The paucity of comparable time series data prevents a complete examination of changes over time for the entire period. Thus, the broad classification over a shorter time span since 2011 is summarized in Figure 7. As of 2016, almost half of the labor force was self-employed, while almost a third was employed as casual labor. Only about one-sixth received regular wages or salary payments, and over 3% of all workers were contract workers. According to the International Labour Organization, temporary employment suggests that workers are engaged only for a specific period of time, including fixed-term, project-, or task-based contracts, as well as seasonal or casual work, including day labor. Similarly, according to OECD statistical definitions, workers in short-term employment are those who hold explicit or implicit contracts of employment that are expected to last longer than the period used to define casual workers, but shorter than that used to define regular employees.
Over 92% of India’s labor force was employed in the informal sector in 2004–2005. The informal sector essentially refers to workers who are not covered by labor regulations, although such workers are included in all estimates of the total labor force as presented above (for details on informality in India see [3] and [4]). Despite high growth over the following five years, this proportion hardly changed. The total number of those employed also remained practically the same, at about 460 million. Figure 8 shows the changes in the small share of organized jobs within the informal sector and the rising share of unorganized jobs within the formal sector between 2004–05 and 2009–10. The proliferation of unorganized jobs within the formal sector typically implies that workers are not given long-term contracts; do not get the benefit of wage negotiations between labor unions and governments; are not entitled to mandated working hour regulations; and are generally not covered by labor legislation prevailing in the country, except perhaps the enforcement of minimum wages.
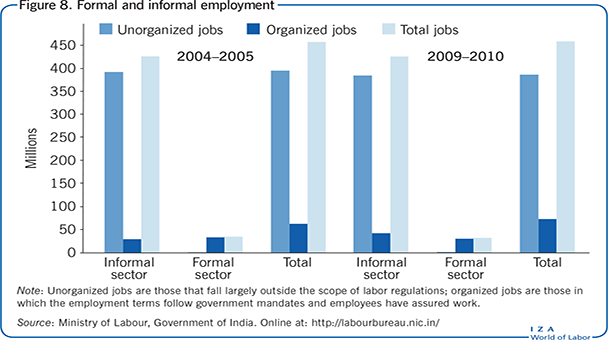
Apparent stability in the size of the informal sector masks two underlying divergent trends. The share of workers in the unorganized sector, largely outside the scope of labor regulations, fell from about 86% in 2004–2005 to about 82% in 2011–2012. However, the share of informal workers in the organized sector (the sector in which the employment terms follow government mandates and employees have assured work) increased significantly because of a greater use of fixed-term contractual and other casual worker arrangements. The share of contractual labor in organized manufacturing increased from 15.6% at the end of the 1990s to 34.7% in 2011–2012. Moreover, the share of non-agricultural wage workers without written contracts increased from 74% in 2004–2005 to 79% in 2011–2012. Because of these countervailing trends, the overall proportion of informal workers in total employment has remained relatively stable at around 92% [5]. As written contracts are almost entirely absent for agricultural wage workers, it follows that more than 80%, and perhaps as high as 90%, of all wage workers may be estimated to have had no written labor contract in 2011–2012.
Movements in wage rates
The average real daily wages for regular wage employees between the ages of 15 and 59 increased by about 23% for rural workers between 2004–2005 and 2011–2012 and by about 29% for urban workers between 2004–2005 and 2009–2010 [1]. As already noted, however, regular wage and salaried employees only constitute around 15% of the labor force. Given the continuing preponderance of self-employment in India, especially in agriculture, movements in wage rates provide a rather partial picture of returns to work in the country. Furthermore, the overwhelmingly informal nature of employment makes any estimate of wage movements suspect. Nonetheless, some broad patterns can by identified in rural wage employment and the manufacturing sector. Estimates suggest that in real terms, average agricultural crop worker wages had been quite volatile and declined slightly overall from the mid-1980s into the early 2000s [6]. Figure 9 illustrates estimates of movement in average wage rates for rural unskilled labor thereafter.
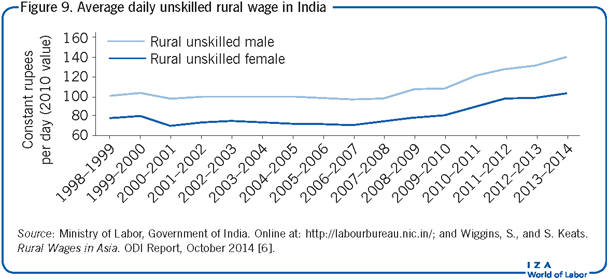
After stagnating during the first half of the 2000s, rural unskilled wage rates started increasing on average from 2007. By 2013–2014, male real wages had increased by about 35%, while female wage rates increased by about 40%. From a low of about 70% in 2000–2001, the female-to-male wage ratio consequently increased somewhat, to close to 80% by 2013–2014. This increase was probably caused at least partially by the introduction of a national rural employment guarantee program in 2006, expanded to cover all districts in the country in 2008. This program aims to provide at least 100 days of wage employment in a fiscal year to every household whose adult members volunteer to do unskilled manual work. While the actual average provision of wage employment has been far less than the targeted 100 days a year, the timing of the upturn in rural wages does appear, prima facie, to suggest a significant positive impact of the program. However, there is an open question as to whether the fall in global prices of agricultural commodities and successive droughts in many parts of the country, combined with funding constraints recently faced by the program, may have negated or reduced these rural wage gains in the last three years. Interestingly, as will be discussed below, the upturn in rural wages during 2007–2013 was accompanied by a rise in real wages in the organized manufacturing sector. However, the latter was only about 15%, proportionately less than half the cumulative growth rate of over 35% registered by rural unskilled wages. This implies a significant narrowing of the difference between rural unskilled wages and wages in organized manufacturing over 2007–2013.
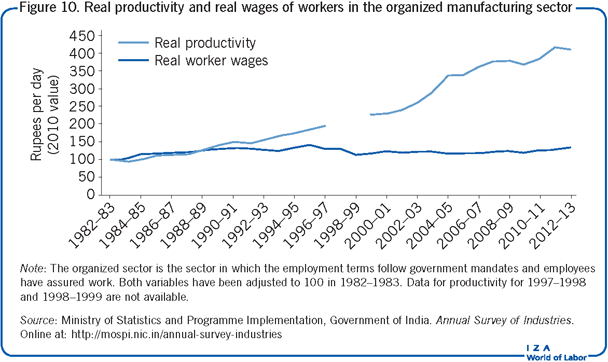
Unlike in Southeast Asia, GDP growth in India has not been associated with any sharp increase in wage rates of workers in large-scale (i.e. organized) manufacturing units. Productivity growth started outpacing wage growth around 1990. Large-scale manufacturing productivity appears to have almost tripled on average during 1990–2013. Strikingly, however, workers’ average real wages seem to have completely stagnated. Figure 10 illustrates this phenomenon. Real wages increased moderately until 1995–1996 and fell sharply over the three subsequent years. After a two-year partial recovery, stagnation set in between 2000–2001 and 2007–2008. There was a gradual rise over the five subsequent years, but this rise was so weak that average real wages had not caught up to their 1995–1996 level, even by 2012–2013.
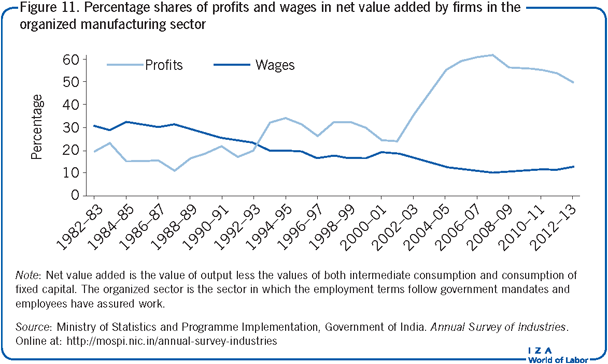
The long-term stagnation in wages can reasonably be ascribed to a combination of the weakening of trade unions, a structural shift toward capital-intensive industries, increasing automation within labor-intensive industries, outsourcing, and greater use of badly paid casual and contract labor. As depicted in Figure 11, factory employment did not rise sharply enough to counteract the negative effect of declining wages on the share of wages in net value added (i.e. the value of output less the values of both intermediate consumption and consumption of fixed capital) by firms. Consequently, the latter declined from about 26% in 1990–1991 to about 17% in 1995–1996, before recovering somewhat to about 20% by the end of the decade. It fell steadily thereafter to reach about 11% in 2007–2008, before recovering marginally to 13% by 2012–2013. Thus, the share of wages in net value added by firms halved between 1990 and 2013. Conversely, the share of profits increased from about 22% in 1990–1991 to about 30% in 1999–2000. After a two-year fall, it entered a period of explosive growth in 2001–2002, reaching almost 62% in 2007–2008 before declining steadily to about 50% by 2012–2013.
Not only did workers in organized manufacturing lose out relative to employers, they also lost out relative to supervisory and managerial workers. The share of wages going to production workers fell from about 58% of the total wage bill to about 49% between 2000 and 2012, while that of supervisory and managerial staff increased from 26% to 36%. The ratio of the average wages of supervisory and managerial staff to production workers increased from 3.6 to 5.8 over this period. Downward pressure on the share of wages to production workers had much to do with an increasing use of contract workers rather than directly employed permanent workers. Contract workers are hired via independent contractors, can be hired and fired at will, and receive only about half the wages of permanent workers. The share of production workers employed through contractors in total employment in the organized manufacturing sector rose from about 16% in 2000–2001 to almost 27% in 2011–2012, while that of directly employed production workers fell from about 61% to 51% in the same period. The increase in contract workers accounted for close to 50% of the total increase in employment in the organized manufacturing sector [7].
Limitations and gaps
The biggest hurdle in carrying out rigorous empirical analysis of India’s labor market is the absence of reliable earnings data. As already noted, over 90% of India’s workforce is employed in the informal sector, and less than 20% is engaged in regular wage or salaried occupations. About half of India’s GDP is generated in the informal sector. Informal sector enterprises do not report earnings or wage data and, at a conservative estimate, over 80% of all workers do not even have written contracts. Fewer than 4% of all Indians report their incomes for income tax assessment, and under-reporting is universally acknowledged to be extensive. Furthermore, until recently, income tax data were not made publicly available by the government for analysis. Consequently, estimates of income distribution as well as employment have to be derived almost entirely from large-scale sample surveys. These surveys are, however, episodic, and have traditionally focused on self-reported consumption expenditure rather than income. Those which do incorporate income estimates are bedeviled by the problems of self-reporting compounded by the informal and fluctuating nature of occupations as well as large-scale use of family labor in agriculture and household industries in rural areas.
Employment estimates suffer from analogous difficulties. Furthermore, the issue of under-employment and disguised unemployment is likely to be important, but impossible to capture satisfactorily in surveys when work is predominantly either of the self-employed or casual labor kind. These data limitations make detailed analyses of employment and earnings trends outside the formal sector in India difficult beyond a broad impressionistic level. While long overdue, the country still does not have a longitudinal survey of occupations, income, or internal migration for example.
Summary and policy advice
Increasing the impact of output growth on employment outside agriculture, bringing a larger proportion of the population within the ambit of income tax, and formalizing the informal sector remain India’s greatest policy challenges. Without the first, substantial labor transfers from the overcrowded agricultural sector cannot be realized. Without the second, the income tax mechanism cannot be used to reduce inequalities generated by the labor market in any substantive sense. Without the third, even a modest system of worker protection and a universal social safety net would both remain almost impossible propositions. Expanding the coverage of the current National Rural Employment Guarantee Scheme and maintaining it over the next 15–20 years could play an important role in attaining the first objective. Stepping up the growth rate of the manufacturing sector is also essential, since manufacturing in India exhibits the highest employment elasticity of output growth among sectors, in particular for unskilled workers. The second requires plugging major loopholes in tax laws, especially eliminating the tax-free status of agricultural income, and a major improvement in tax compliance. A substantial improvement in the ability of the legal system to deliver cheap, quick, and binding arbitration is also essential in this context. The third requires the elimination of the many policy-induced distortions that favor smaller operations and negate both technological and financial economies of scale. Also relevant in this context is the highly fragmented nature of India’s land market, the often fuzzy nature of property rights, and the interminable nature of land litigation, all of which work against the easy acquisition of land, which is necessary for large-scale operations. These factors also make it inordinately difficult to build the public infrastructure necessary to support large-scale operations. Without sustained and proactive government intervention in the land market (a political hot potato in India), enterprises will continue to face major obstacles to scale expansion. The fragmented and highly dispersed nature of work sites will, in turn, continue to deter unionization of the casual and contract labor force and the expansion of at least some labor protection legislation to cover these segments.
Acknowledgments
The authors thank an anonymous referee and the IZA World of Labor editors for many helpful suggestions on an earlier draft.
Competing interests
The IZA World of Labor project is committed to the IZA Guiding Principles of Research Integrity. The authors declare to have observed these principles.
© Indraneel Dasgupta and Saibal Kar