Elevator pitch
From 2000 to 2019, Canada's economy and labor market performed well. Important in this success was a strong resource boom from the late 1990s to 2014. After the boom the economy and labor market adjusted relatively smoothly, with labor and other resources exiting resource-rich regions and moving elsewhere. Strong growth in major export markets (Asia and the US) aided the adjustment. The Covid-19 downturn resulted in an unprecedented decline in employment, and a steep rise in unemployment and non-participation. Despite the severity of the Covid-19 shock, by December 2021 most key measures of labor market activity had returned to pre-pandemic levels.
Key findings
Pros
Economic downturns during 2000–2019 were much less pronounced than during the 1980s and 1990s.
With the exception of the Covid-19 downturn, recent recessions in Canada have been much milder than in the US and much of Europe.
After rising markedly during the 1980s and 1990s, income inequality has been relatively stable since 2000 and declined a bit after 2008.
The male–female earnings gap has continued to decline, as have the earnings gaps between union and non-union workers and permanent and temporary/casual workers.
Cons
The end of the resource boom in 2014 required substantial labor reallocation due to job losses and unemployment in resource rich regions.
Real wage gains from 2000 to 2016 were modest in size—but nonetheless greater than during the preceding 20 years.
Real earnings gains were very unevenly shared in the 1980s, 1990s, and early 2000s, with especially large gains at the top of the wage distribution.
The labor market became polarized in terms of “good” (high-skill and high-paid) and “bad” jobs between 1970 and 2000, but has since stabilized.
Author's main message
The labor market performance has been good (but not excellent) since 2000, and Canada avoided the worst effects of the 2008 financial crisis. Since 2000, real earnings have grown at a modest pace and income inequality has remained relatively stable. Despite these positive outcomes, the share of earnings received by the top 1% and 10% substantially exceeds levels experienced earlier in the post-war period. The resource boom and the accompanying high value of the Canadian dollar brought about substantial reallocation of labor and other resources into resource-rich regions, which reversed post-boom. Covid-19 resulted in an unprecedented decline in employment and huge increases in unemployment and non-participation. Despite this, by December 2021 most labor market measures had returned to pre-pandemic levels. Looking ahead, a central challenge will be achieving “inclusive growth.”
Motivation
Knowing the facts about a labor market is crucial for understanding labor market policy and for having a relevant background for discussing labor markets worldwide. Equally important is knowing which aspects of a country's labor market are performing well and which ones are doing poorly. This article provides these facts and background for Canada, a small open economy that relies heavily on international trade and which has a large resource sector.
Discussion of pros and cons
Aggregate issues
The Canadian unemployment rate and the incidence of long-term unemployment over the 2000–2021 period are plotted in Figure 1. Also shown is the employment rate (employment to population ratio) which is not dependent on the rather murky distinction between unemployment and non-participation. The highlighted areas indicate recessions.
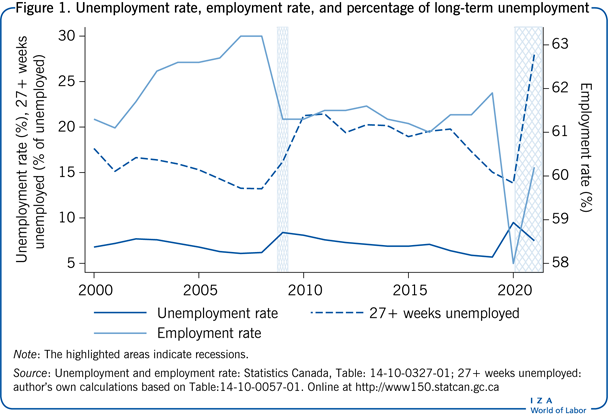
Canadian economic downturns have been much less severe since 2000 than they were before. The recessions of 1981–1982 and 1990–1992 were Canada's two worst recessions of the post-war period; since the turn of the century, increases in the unemployment rate and long-term unemployment were much smaller than during these earlier downturns. The unemployment rate peaked at much higher levels in 1983 (11.6%) and 1993 (10.8%) than subsequently, and the incidence of long-term unemployment hit post-war highs during the 1980s and 1990s that have not been experienced since 2000. Even the sharp rise in unemployment in 2020 to 9.5% was well below these earlier peaks. Declines in GDP and employment were also much greater in the earlier downturns.
The Canadian and US economies are highly integrated, and trade with the US constitutes a substantial amount of Canada's economic activity. However, Canada's economy is only one-tenth the size of the US’s, so is heavily influenced by developments south of the border. As former Prime Minister Pierre Elliot Trudeau stated, “When the US sneezes, Canada catches a cold.” This statement certainly applied in the 1980s and 1990s, but since 2000 downturns have hit much harder south of the border. In 2001 the US experienced a recession associated with the IT crash; Canada, meanwhile, had a mild slowdown that lasted only one quarter, so was not officially a recession. Moreover, unemployment rose much more in the US than in Canada, and the unemployment rate gap between the countries narrowed.
During the Great Recession associated with the 2008 global financial crisis, unemployment increased substantially more in the US than in Canada, reversing the previous pattern of higher unemployment in Canada. Additionally, Canada's incidence of long-term unemployment increased much less than in the US.
A major factor contributing to relatively favorable aggregate performance was the resource boom of 1999 to 2014. With the collapse of oil and other natural resource prices in 2014, Canada experienced a period of slower overall growth, a decline in the value of its currency, substantial reallocation of labor resources out of the resource-rich regions (Alberta, Saskatchewan, and Newfoundland) and a gradual recovery of employment and output in central Canada (Ontario and Quebec), in part helped by rapid growth in key export markets in Asia and the US. During this slow growth period (roughly 2014–2016) there were modest declines in the employment rate and increases in unemployment, both in contrast to the US. Once the adjustment was complete, rapid gains in Canadian employment and reductions in unemployment resumed until they ended abruptly in early 2020 as a result of the steep Covid-19 downturn—which resulted in an unprecedented decline in the employment rate of 10 percentage points in March and April 2020 and an increase in unemployment to almost 14%. However, by summer 2020 a solid recovery was underway. Despite periodic setbacks during successive waves of the pandemic, most key measures of labor market activity had returned to their pre-pandemic levels by December 2021 [1].
Labor force participation—Aggregate, by gender and by age
The aggregate labor force participation rate over the period 2000–2021 is shown in Figure 2, together with breakdowns by gender and age. Prior to the onset of Covid-19, the aggregate rate showed little change, with almost identical levels of 65.8% in 2000 and 65.6% in 2019, followed by a decline and recovery during 2020–2021. Underlying the apparent stability, however, were noteworthy developments. At the aggregate level, participation rose gradually from 2000 to 2003 (a period of buoyant economic conditions), remained stable until the financial crisis, and declined from 2008 to 2019 (after the financial crisis and the end of the resource boom). These changes are broadly consistent with the view that recent movements in participation are driven primarily by aggregate economic conditions. However, further examination indicates that trends in participation among different age groups also play important roles.
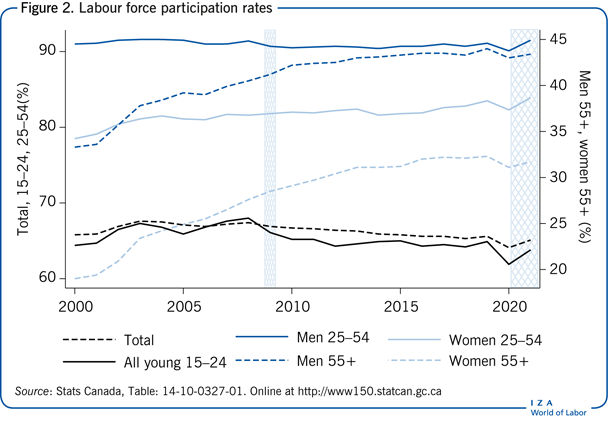
Participation among prime-age men (aged 25–54 years) has been remarkably stable since 2000. The rate dipped slightly during the 2008–2009 recession, but by 2021 slightly exceeded its 2000 level. For women aged 25–54, labor force participation increased by more than 5 percentage points between 2000 and 2021, with the upward trend occasionally interrupted before resuming its climb. The rise in female participation is a continuation of earlier trends. Since 2000 it was further encouraged by enhancements of “family-friendly” policies such as greater availability of subsidized daycare.
Combining women and men aged 25–54 (not shown in the figure) yields an increase of more than 1.5 percentage points in labor force participation since 2000. The combination of stability in aggregate participation and moderate gains in participation of prime-age workers contrasts sharply with the US, where substantial declines in participation occurred.
Figure 2 also shows participation trends for young adults (those between 15 and 24 years of age) and older workers (55 and older). Among young workers, the levels and changes in participation are very similar for men and women, so the combined series is shown. However, there are clear gender differences in the older age group, so separate series are shown.
Participation of 15–24 year olds rose by almost 3 percentage points during the period of strong economic growth in 2000–2008, but fell substantially during the 2008–2009 recession before leveling off, resulting in little overall change between 2000 and 2019. The sharp rise during the 2000–2008 period is consistent with evidence from previous resource booms that young adults (especially young men) become more likely to choose work over school when they can earn unusually high salaries.
Policy concerns were voiced during the resource boom that young men were leaving school “too early” (especially before completing high school) in the resource-rich regions, and that doing so might not be in their (or society’s) best long-term interests. While this may have been a legitimate concern, analysis of previous resource booms concludes that many of those who leave school early subsequently return to it, indicating that temporarily high earnings alter the timing, but not necessarily the total amount, of education acquired [2]. The substantial decline in this age group's participation after 2008 is consistent with this behavior, and more generally with the finding that teenagers and young adults stay in school longer (or return to school) during periods of weak economic activity.
Younger workers were also more adversely affected than other groups by the Covid-19 shock, as evidenced by their sharp reduction in participation in 2020 and partial rebound in 2021.
Labor force participation rates of those aged 55 or over are much lower than for other groups (see right-hand scale in Figure 2). After declining for many years, participation rates for older men bottomed out in the 1990s and have been rising since. The increase from 2000 to 2021 of more than 10 percentage points is a continuation of this recent trend. The increase for women in this age group is even more substantial—from 19% in 2000 to almost 32% in 2021. The front end of the baby-boom generation is driving these large increases in participation, which appear to be attributable to several factors. Key contributors include greater longevity together with declining pension coverage (especially in the private sector) and a shift away from defined benefit pension plans toward defined contribution plans. Policy changes have also played a role; for example, the previous single retirement age of 65 (with some options for earlier retirement with a reduced pension) in the Canada Pension Plan was replaced by a “retirement window” from age 60 to 70 and a sliding payment schedule that results in a higher monthly pension for those retiring later. Similarly, mandatory retirement is now banned throughout the country. The rise in female participation among older women is also driven by women returning to the labor force after child rearing, and wanting to remain actively employed for longer thereafter. Canadian evidence indicates that this also results in married men remaining employed longer because of a desire for spouses to retire at similar points in time [3].
The Covid-19-related lockdowns beginning in March 2020 resulted in a dramatic decline in employment, a steep rise in unemployment, and an increase in non-participation. Exit from the labor force was evident in all demographic groups although larger for women than men and somewhat greater among the youngest and oldest age groups. Many of these individuals remained attached to the workforce, for example reporting that they wanted work although they were not searching for work. Nonetheless, 2021 participation rates of the youngest and oldest groups remain below their 2019 levels, suggesting that for some their departure from the labor force may not be temporary.
The demographics of unemployment—Age and gender
Youth unemployment rates in Canada are typically two to three times those of adults, principally due to substantially more turnover and “churning” in the youth labor market. Offsetting the greater incidence of unemployment among youth is its shorter duration—generally one-half to two-thirds that of adults—and substantially lower long-term unemployment—about one-half that of adults. For these reasons higher youth than adult unemployment rates are typically not regarded as a serious policy concern.
Figure 3 shows unemployment for youths and young adults combined (those aged 15–24) and other groups. Youth/young adult unemployment peaked at 15% during the 2008–2009 recession, and reached almost 20% in 2020 but the ratio of youth to total unemployment (about 1.8) was very stable during the 2000–2021 period. The incidence of long-term unemployment among youths also remained low during the 2000–2021 period—approximately half that of adults.
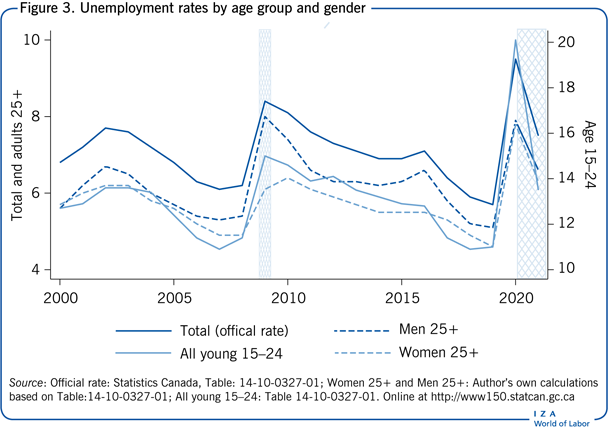
For unemployment rates of those aged 25 and older, prior to the 1980s women had higher unemployment rates than men, principally due to much higher incidence of unemployment associated with more frequent labor force turnover. However, with female labor force attachment continuing to rise, male unemployment rates have exceeded those of females since the 1990s. As seen in the figure, this pattern is also evident during the 2000–2021 period. The gap between male and female unemployment rates widened substantially during the financial crisis, reaching 2 percentage points in 2009, and increased again with the end of the resource boom (which had favoured male employment) in 2014. The reverse occurred during the Covid-19 downturn which adversely affected women more than men, resulting in almost equal male and female unemployment rates in 2020–2021.
Wage developments
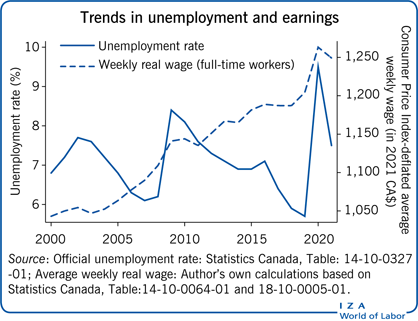
Most families earn their income from work, so changes in real wages (wages relative to the cost of living) are a key influence on the evolution of living standards over time. Weekly wages (or earnings) reflect both the employee's hourly wage and hours worked per week. Here the focus is on full-time workers, those who work at least 30 hours per week at their main job and who exhibit the strongest attachment to the labor force. However, very similar behavior is exhibited using data for all workers, that is, including those who work part-time or in temporary or casual employment. The Labour Force Survey (LFS) data are representative of the adult population aged 15 and over.
Figure 4 reports two commonly used measures of change in real wages for representative workers: mean (or average) real wages and median real wages. Wages in nominal dollars are deflated by the Consumer Price Index (all items) to obtain real wages (in constant 2021 Canadian dollars). To start, the focus is on real wage changes over the 2000–2019 period because the Covid-19 years (2020–2021) are affected by a substantial compositional change in the workforce, as discussed below.
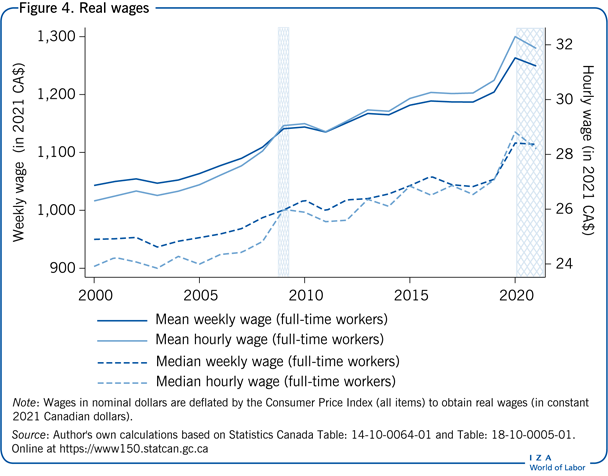
Three features of the 2000–2019 data in Figure 4 are noteworthy. First, the average wage exceeds the median wage for both hourly and weekly wages. This reflects the fact that some employees receive extremely high wages. The presence of these top earners pulls up the average wage but does not influence the median wage. Second, average real wage growth exceeds median wage growth by a substantial amount. This difference arises because wage gains were larger for those at the top of the wage distribution than for those in the middle. A third salient feature is that all measures of real wages increase over this 19-year period—increases range from 11% for the median weekly wage to 17% for the mean hourly wage, or from 0.6% to 0.9% per year. Although an improvement over the 1980s and 1990s, during which real wages grew very little [4], these gains are much smaller than those achieved early in the post-war period. Gains were largest in the period 2003–2009, were interrupted by the 2008–2009 financial crisis and the end of the resource boom in 2014–2015, and resumed in 2018–2019.
The dramatic real wage increase in 2020 and subsequent sharp decline in 2021 reflects a large compositional change in the workforce, with high-wage workers (many who could work from home) remaining employed after the initial Covid-19 shock and many low-wage workers (such as those in the hospitality sector) being more likely to be laid off. Thus the huge measured wage increase in 2020 and sharp decline in 2021 do not reflect wage changes for the typical worker [1].
Wage and income inequality
After a prolonged period in which the distribution of income was remarkably stable, Canada—like many other industrialized countries—has experienced rising wage and income inequality since the late 1970s. Canada is in the middle of the pack in terms of income inequality compared to other OECD countries. The level of inequality is above that of most EU countries—especially the Scandinavian countries—but below that of others, such as Australia, Italy, Japan, the UK, and the US. Similarly, the extent to which inequality increased since the mid-1980s is average for the OECD, although in this case the countries that had larger increases include low-inequality countries, like Sweden, Finland, Denmark, and Germany, as well as Japan and the US [5]. However, some features of the Canadian experience are unique.
Figure 5 provides several commonly used inequality measures over the period from 1982 to 2019/2020 (the most recently available data). The first is the Gini coefficient for family market income before government transfers and taxes, adjusted for family size. Canada's Gini coefficient rose by 13% over this period, a substantial increase in a measure that is not easy to move. However, the growth in inequality was highly uneven. Inequality shot up during the 1981–1982 recession, declined gradually during the subsequent period of strong economic growth, but remained above its pre-recession level at the peak of the business cycle in 1989. The recession of the early 1990s brought another sharp increase, but inequality continued to rise during the subsequent expansion, principally because of major cutbacks in income support programs [6].
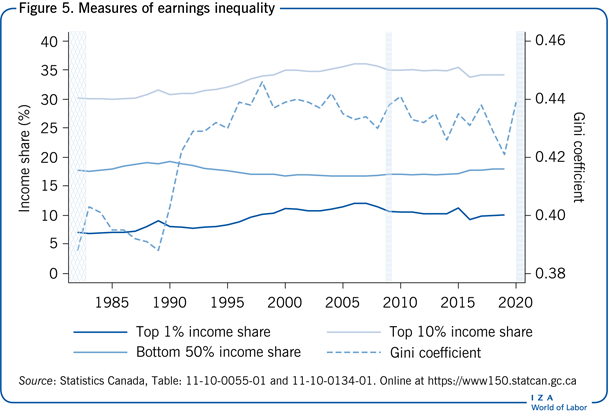
The remaining series in Figure 5 provide measures of income inequality at the individual level based on income tax returns. In Canada these are filed on an individual, not family, basis. Compared to survey data, advantages of these data include (i) less measurement error due to imperfect recall and non-response to income questions and (ii) absence of top-coding (which occurs when observations above a certain income level are censored for confidentiality reasons). However, tax data are less timely—2019 is the most recent year available—and for confidentiality reasons only aggregate measures are released. Figure 5 shows the shares of total income received by key segments of the income distribution: the bottom 50%, top 10%, and top 1%.
Several features stand out. The share of income received by the bottom 50% rose after the 1981–1982 recession from under 18% to its peak of 19.3% in 1990. During the 1990s it fell steadily, reaching a low of 16.8% in 2000. Subsequently this share increased gradually to 18% in 2019. Shares of income received by top earners displayed much more dramatic changes. The fraction of total income received by the top 1% and top 10% rose sharply between 1982 and 2008—by 62% and 18% respectively—but have declined modestly since peaking in 2008. Over the entire 1982–2019 period, the share of income going to the top 1% increased from 7% to 10%, an increase of more than 40%, while that received by the top 10% rose from 30% to 34%, an increase of 13%.
Both the individual and family income measures illustrate a striking feature of Canada's experience that contrasts with trends in many other countries—income inequality stopped rising around the turn of the century, and remained stable or declined somewhat thereafter. Despite a modest increase in the Gini coefficient during the 2008–2009 financial crisis, its 2019 value is lower than in the late 1990s.
A comprehensive examination of Canada's experience with income inequality attributes this leveling off of inequality growth to two principal factors [7]. One is the behavior of minimum wages, which vary by province in Canada. After falling during most of the 1980s and 1990s, real minimum wages have risen steadily since the early 2000s. Comparing the observed wage distribution in 2015 to an estimated counterfactual distribution in the absence of the increases in minimum wages concludes that these minimum wage increases had a large impact at the bottom of the wage distribution, especially in the bottom decile [8]. Particularly large minimum wage increases have occurred since 2015.
The second contributing factor was the resource boom that began in the late 1990s and lasted until mid-2014. Although the economic effects of this boom were regionally concentrated, its impacts were large enough to have significant effects at the national level [9]. The boom “lifted all boats” and had especially large impacts on wages for those with high school education or less. Indeed, if Ontario and Quebec—Canada's two most populous provinces—are focussed on, since 2000 income inequality increased in these non-resource-intensive regions in a manner similar to that of the US.
Polarization of Canada's labor market
In the US and many EU countries, rising wage inequality has been accompanied by employment polarization—with increasing numbers of workers employed either in high-paid “good jobs” or low-paid “bad jobs.” These trends have also occurred in Canada [4], [10]. For example, the percentage of full-time, full-year workers at the bottom of the earnings distribution (those earning less than 50% of median earnings) increased from 8–9% in 1970 to 14% in 2005 for both men and women; meanwhile, the fraction of those at the top (earning more than 200% of the median) also rose, from 5–6% to 10%. The size of the middle class (those earning between 50% and 150% of the median) fell from 75% to 63% over the same period [10]. Those with middle-class earnings continue to constitute the largest group, but the size of this category has fallen substantially over time. A similar finding holds if the groups are classified by occupation: employment in cognitive task occupations, such as professional and management (which tend to be high skill and well paid), rose steadily over the 25-year period 1970–2005, as did employment in non-routine manual occupations, such as sales and services (which tend to be poorly paid). In contrast, employment steadily declined in routine task occupations such as production, crafts, and operatives, as well as for secretaries and clerical jobs, which historically have paid relatively well [4].
Interestingly, however, job polarization stopped after 2000 [4]. The forces that contributed to the leveling off of rising wage inequality may also have halted, at least temporarily, the rising polarization of employment.
Female–male earnings differences
Female wage gains relative to males have been a pervasive feature of Canada's labor market for several decades. For example, comparison of the distributions of earnings improvements from 1970 to 2005 shows that women experienced substantially larger gains in real weekly earnings than men throughout most of the distribution [11]. At the 10th percentile, women's earnings grew by 5% compared to a 10% decline for men; at the median, women's real earnings grew by 20%, whereas men's earnings were flat over this 25-year period. At the 90th percentile the gains were more than 30% for women versus 18% for men.
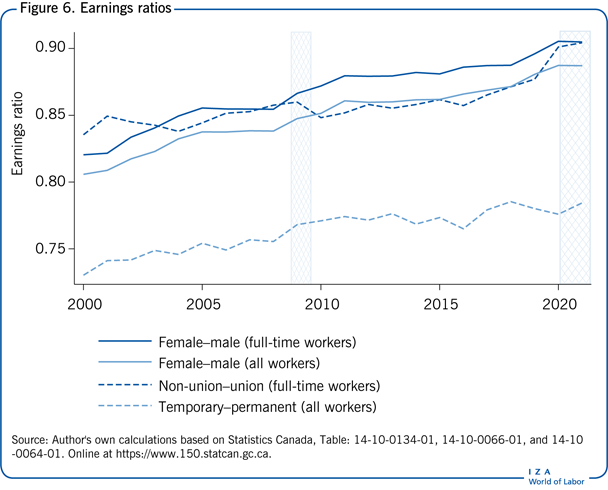
Figure 6 plots the ratio of female to male hourly wages over the 2000–2021 period. Although complete equality has yet to be achieved, the gender gap continued to decline—the female–male ratio rose from 0.82 to 0.90 for full-time employees and from 0.81 to 0.89 for all employees. The absence of further narrowing of the gender gap in 2020–2021 is principally due to the compositional change in the employed workforce discussed previously, that affected women more than men.
Many factors have contributed to the narrowing of the gender wage gap—such as significantly more rapid gains in educational attainment among women than among men, substantial increases in female labor force attachment, and increasing representation of women in well-paid professions, such as medicine, law, and accounting. However, one factor that contributes to an ongoing gender gap in average earnings is the low representation of women among the highest earners. Men constitute the overwhelming majority of Canada's top 1% [12]. Although their share has fallen steadily over time, it remained about 80% in the most recent Census, the best data source for top earners.
Union–non-union wage differences
The nature of Canada's unionized workforce has changed dramatically in recent decades. Unionization has fallen steadily in the private sector but risen or remained stable in the public sector. Union coverage rates are now five times higher in the public sector than the private sector. As a consequence, the majority (about 60%) of the unionized workforce is in the public sector even though that sector accounts for only 20% of total employment [13]. This change has been accompanied by a remarkable rise in the share of women among unionized employees—now over 50%.
Accompanying these profound changes, the gap in hourly wages between union and non-union workers has narrowed—from 16 percentage points in 2000 to 12 percentage points in 2019 (Figure 6).
Wage differences between permanent and temporary workers
Another noteworthy change in Canada's labor market has been the growing importance of non-standard or contingent employment (temporary, contract, casual, and seasonal work). Since 1997 the monthly LFS has included questions relating to contingent employment. One concern about the increased prevalence of non-standard work is its association with lower wages and more limited non-wage benefits.
As indicated in Figure 6, the wage gap between temporary and permanent work is indeed large—more than 25 percentage points in 2000. However, it did narrow substantially (from 17 to 12 percentage points) over the 2000–2021 period.
Limitations and gaps
The most significant development in Canada's labor market is the dramatic rise in incomes at the top of the distribution. The vast majority of this income is payment for labor services, not other sources such as investment income [12]. However, traditional household surveys do not capture these earnings well because of top-coding in survey data as well as non-response to earnings questions. The best source of information is income tax data—the source used in the income share series shown in Figure 5. However, such data are only available with a time lag. Also, they are not made available in a manner that permits calculation of inequality measures such as 90/10 and 90/50 earnings differentials. Most importantly, many professionals receive earnings through personal private corporations, and only the amount taken out of the corporation each year is reported for tax purposes. Thus, the income shares in Figure 5 probably understate the rise in top incomes.
Summary and policy advice
Canada's economy and labor market performed well during the 2000–2021 period, at least compared to the previous two decades. The absence of major recessions such as those experienced in the 1980s and 1990s played an important role in this performance. A related factor was the 15-year resource boom that ended in 2014. A major concern at that time was that trends that were ameliorated by the boom—rising inequality and low real wage growth for most workers—would re-emerge. However, as noted previously, the re-allocation of labor out of resource-intensive regions went relatively smoothly. Although income inequality remains much higher than in the 1970s, it has stopped increasing and by several measures has fallen by a modest amount since 2008. At the bottom end, substantial increases in real minimum wages since the early 2000s appear to have contributed to the levelling off (and even small declines) in growing inequality. Since the financial crisis in 2008–2009 the shares of income received by top earners have declined somewhat but remain at historically high levels.
The most promising policy changes for reducing inequality are those affecting the pre-tax and transfer income distribution [7]. Nonetheless, Canada's tax and transfer system can also contribute. Although tax rate adjustments are possible, it would be preferable to work toward eliminating unnecessary tax preferences used disproportionately by high earners.
Acknowledgments
The author thanks an anonymous referee and the IZA World of Labor editors for many helpful suggestions on earlier drafts. The author further thanks Mallory Felix and Shritanjay Bhatia for excellent research assistance, Nicole Fortin, David Green, and Thomas Lemieux for helpful comments and the SSHRC for financial support. Version 2 of the article updates the text and figures to 2021, including the effects of Covid-19 on the labor market.
Competing interests
The IZA World of Labor project is committed to the IZA Code of Conduct. The author declares to have observed the principles outlined in the code.
© W. Craig Riddell