Elevator pitch
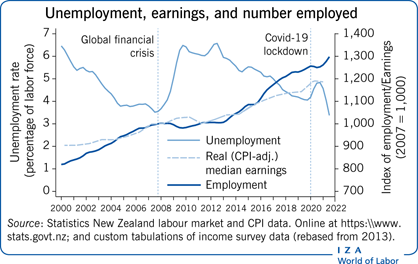
New Zealand is a small open economy, with large international labor flows and skilled immigrants. After the global financial crisis (GFC) employment took four years to recover, while unemployment took more than a decade to return to pre-crisis levels. Māori, Pasifika, and young workers were worst affected. The Covid-19 pandemic saw employment decline and unemployment rise but this was reversed within a few quarters. However, the long-term impact of the pandemic remains uncertain.
Key findings
Pros
Employment rates are above 2000 levels, despite strong population growth; and high employment rates, rising for older workers, are accompanied by low unemployment.
There is moderately strong real wage growth, even with slow growth during the GFC recovery, and relative wage growth for women and the low-paid, reducing the gender wage gap and compressing the wage distribution.
There has been strong growth in qualifications.
Lower job turnover rates indicate greater job stability.
New Zealand is recovering since the 2020 Covid-19 pandemic.
Cons
Long-term unemployment (i.e. six months or more) remains high at around 30% of total unemployment.
Young workers as well as Māori and Pasifika ethnic groups still face relatively high unemployment rates.
Wage inequality has risen somewhat in the upper half of the wage distribution since 2000.
Qualification premiums have declined.
Author's main message
Following almost ten years of sustained GDP growth, New Zealand entered an economic downturn in the first quarter of 2008, which was prolonged by the GFC later that year. The labor market recovery was slow until 2013, when it was reflected in net immigration, employment growth, and unemployment declines. Labor market liquidity has remained low since the 2008 downturn, with rates of hires, separations, job creation, and job destruction all still below pre-2008 levels. Overall real earnings growth has been moderately strong, though slightly faster for women, leading to a narrowing of the gender wage gap; however, the gap remains significant for women aged 30 and over. The short-term labor market recovery from Covid-19 has been strong but the longer-term impacts are still unclear.
Motivation
Changes in the New Zealand labor market since 2000 reflect longer-term forces that are instructive for all societies. These include a shift from agricultural and goods-producing industries toward service industries, increasing participation of older workers and women, and rising levels of educational attainment. The share of employed people with tertiary qualifications has increased while the associated premium on earnings has decreased. At the same time, there has been compression of wages at the lower end of the distribution, reinforced by minimum wage and pay equity policies. The New Zealand experience highlights issues of broader relevance about skills and equity in the labor market. In particular, it highlights tensions between equitable pay, skills, and migration policies in a small open economy.
Discussion of pros and cons
Employment and population changes
As in many countries, the global financial crisis (GFC) has had a significant influence on New Zealand's labor market. In New Zealand, the GFC brought to an end a decade-long period of sustained employment growth that had increased the number of people employed by 26%. As shown in Figure 1, New Zealand entered recession at the beginning of 2008 and GDP declined until mid-2009 [1]. Employment growth ended in the first quarter of 2009, five quarters after GDP had peaked. Over the following five quarters, employment declined by 1.8%, returning to its 2007 level by mid-2011. It was a further two years before the pace of annual employment growth rose above 1%.
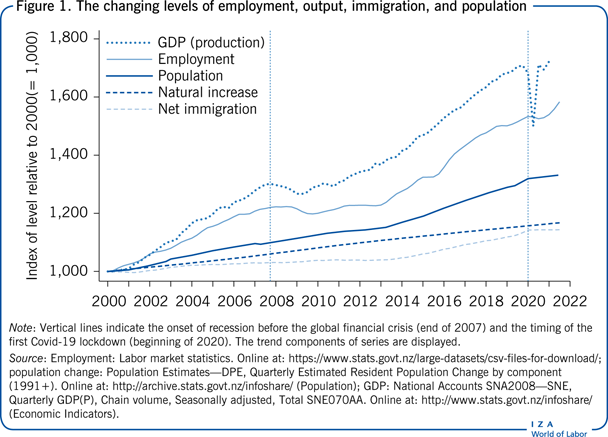
From early 2010 to early 2013, employment grew by 2.7%—more slowly than the 6.3% growth in output, yielding a brief boost to labor productivity. When employment growth picked up in 2013, it coincided with a rise in the net immigration rate, reflecting an increase in international immigrants, as well as a net gain of returning New Zealanders. Due to New Zealand's skill-focused immigration policies, net immigration has served to raise the country's average level of skills.
Because employment growth was accompanied by growth in the working-age population, the employment rate (measured as the proportion of the working-age population that is employed) recovered more slowly than overall employment. In fact, it was not until 2016 that the employment rate recovered to its pre-GFC level of 66%.
Although natural increase contributed more overall to population growth than net immigration between 2000 and 2019, the latter has dominated population growth since 2014, as it did in 2002 and 2003. Figure 1 understates the contribution of migrant flows to population growth as it measures only the estimated resident population, and thus excludes temporary migrants. The number of temporary migrants—mainly on work and student visas—has roughly doubled since 2010, and now stands at over 300,000, equivalent to about 7% of the working-age population. Employment of temporary migrants has thus contributed to employment and output growing faster than measured population growth, as is evident in Figure 1.
The dramatic impact of Covid-19 in the second quarter of 2020 can also be seen clearly in Figure 1. GDP declined by 11% in the June quarter due to the nationwide lockdown that started on March 25, before rebounding by 14% in the following quarter. Employment, however, remained stable, supported to a large degree by an extensive wage subsidy policy, and other policy support in the following quarters. The closing of the borders brought an abrupt halt to the net inflow of migrants, which muted the effect of stalled employment growth on participation and unemployment.
Covid-19 and the New Zealand labor market since March 2020
The first case of Covid-19 in New Zealand was confirmed on February 28, 2020. The country's borders were closed to non-residents and non-citizens on March 19 and on March 25 the country was placed in a four-week lockdown, which closed many workplaces and severely restricted mobility. The lockdown was progressively eased until June 8 but border restrictions remained in force. Less severe regionally focused lockdowns were imposed in August 2020, February 2021, and June 2021 in response to localized Covid-19 outbreaks. A short nationwide lockdown was imposed in August 2021 in response to the delta variant, followed by further localized lockdowns, which were ongoing at the time of writing (November 2021).
The direct labor market impact of the pandemic and the initial lockdown was to prevent all but essential workers from going to work. Even when restrictions were eased, demand for local service workers remained low, and the closed borders put pressure particularly on the tourism and hospitality industries. The policy response to the pandemic was strongly focused on the labor market, “to support New Zealanders and their jobs from the global impact of Covid-19” [2]. On March 17, 2020, before the initial lockdown, the government announced a support package that included a broad wage subsidy, initially for 12 weeks, to keep people employed and maintain incomes while people were not able to work. There was also additional support for people who lost their jobs or were on benefits, and a further tax support for businesses. These forms of assistance were extended and supplemented by a broad range of measures focused on businesses in affected sectors and regions. By December 31, 2020, the government had spent around NZ$18bn on Covid-19-related initiatives, including NZ$13.3bn (4.1% of GDP) on wage subsidies and NZ$1.7bn on small business loans. The Ministry of Social Development reported that, by mid-September 2020, 62% of jobs had received at least some wage subsidy assistance. New Zealand's success in keeping Covid-19 largely under control through 2020 and into 2021, and the substantial policy support to maintain employment and economic activity, resulted in relatively mild labor market impacts of the pandemic [3].
Against the background of cyclical fluctuations and episodes such as the pandemic, longer-term trends continue to shape New Zealand's labor market, including a shift to services. Based on OECD (Annual Labour Force Statistics) statistics, the share of employment accounted for by service industries grew between 2000 and 2020, from 68.3% to 73.6%. In contrast, the primary-industry share (in farming, forestry, fishing, and mining) dropped from 8.5% to 6.0%—which is still relatively high for a high-income economy. The remaining share, in goods-producing industries, dropped from 23.2% to 20.4%. This decline occurred despite a 125% increase in construction employment associated with rebuilding after the 2011 Christchurch earthquake and a post-GFC pickup in construction in Auckland in response to population growth. The number of manufacturing jobs declined between 2000 and 2021 by around 12%, with most of this drop occurring in 2008 and 2009 at the time of the GFC [4].
Demographic variation
The overall changes in employment rates conceal some very different patterns across demographic groups. Figure 2 highlights some of the main differences. Young people (aged 15−24) were particularly hard hit by the post-GFC contraction, experiencing an 8 percentage point employment rate decline from a pre-GFC level of 58%—a level that was not reached again until the third quarter of 2021. The employment impact of the 2020 Covid-19 lockdown, though much less severe, was also most pronounced for young people. In contrast, employment rates for older workers were rising or stable through most of the 2000 to 2021 period.
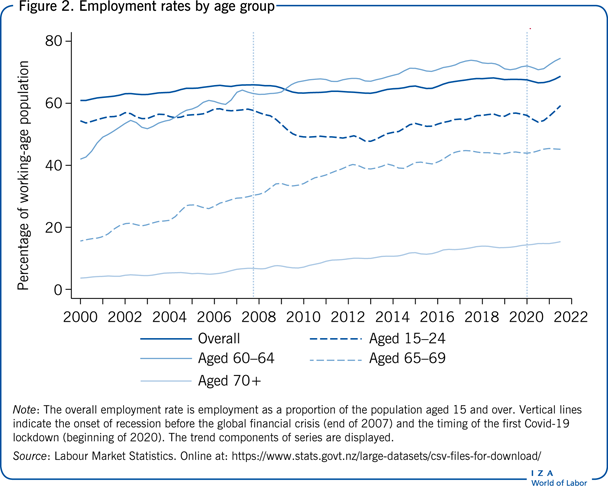
The employment rate of 60−64 year olds rose from 42% in 2000 to 74% in 2017, roughly the same level in 2021 (75%). At age 65, New Zealanders are eligible for a universal, non-means-tested pension (“NZ Superannuation”), although the effect of this on labor supply is small. Furthermore, the strong rise in employment rates is evident even for workers above this age. Employment rates for 65−69 year olds rose from 16% to 45%, and for workers over the age of 70, from 4% to 15%, with most of this rise occurring before 2012. The employment patterns for older workers will have an increasingly strong impact on the labor market as population aging continues. The share of the population aged 65 and over is projected to nearly double over the next 50 years, from 15% to 28%.
The pattern of men's and women's employment rate changes (not shown) was similar to that of the overall employment rate, declining around the onset of the GFC and slowly rising since then. The initial decline was, however, more pronounced and more immediate for men than for women, reflecting men's greater prevalence in declining industries and occupations. Underpinned by a trend increase in female employment rates, the employment rate for women regained its pre-GFC level of 60% by late 2014, whereas the employment rate for men did not reach its pre-GFC level of 73% until late 2017. The drop in employment rates since the Covid-19 lockdown is similar for men and women. In the latest quarter for which data are available (third quarter of 2021), the employment rate for men was 73.2%, still 8.8 percentage points above the rate for women (64.4%). Because men were more adversely affected by the GFC, the gender gap in employment rates has declined from a pre-GFC level of around 14 percentage points.
Unemployment changes
The sustained impact of the GFC, and the brief effect of the Covid-19 lockdown is also evident in unemployment rates, as shown in Figure 3. Unemployment has, however, remained relatively low by international standards, peaking at 6.6% in 2012. In the third quarter of 2021, the rate fell to 3.4%—just below the pre-GFC level of 3.5%. Long-term unemployment has, however, remained relatively high. The proportion of the unemployed who had been unemployed for at least six months rose from 11% in 2007 to around 35% in 2017—a level last seen in 1999—before dropping to 24% by 2020. The impact of Covid-19 has been to reduce outflows from unemployment, which has led to a sharp rise in the long-term share of unemployment to 31% in the second quarter of 2021.
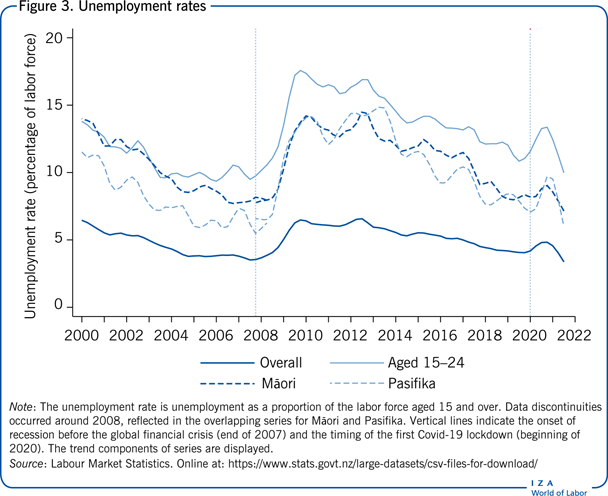
For young people aged 15–24, the unemployment rate rose to 17.6% in 2009 before gradually falling to 10.8% late in 2019—still above pre-GFC levels. Following the March 2020 Covid-19 lockdown, young people's unemployment rose sharply to over 13%, a rise that was just as swiftly reversed within a couple of quarters, to 10.0% in the third quarter of 2021. Sharp and sustained post-GFC increases in unemployment were also experienced by Māori and Pasifika—groups with historically higher than average unemployment rates, related in part to their relative youthfulness and lower average qualifications. Discontinuities in data series, which occurred around 2008, make comparisons with pre-GFC rates imprecise, but it appears that for both Māori and Pasifika, the unemployment rate roughly doubled after the crisis, peaking at almost 15% before dropping slowly to the current level of 6%–7%. Their post-lockdown experience was similar to that of young people, with lower unemployment rates for both Māori (7.1%) and Pasifika (6.0%) in the third quarter of 2021. Both Māori and Pasifika also experienced declines in participation rates due to the crisis, though Māori participation is now at historically high levels, at 68%—slightly higher than it was in 2007 but slightly down from the 71% peak in 2018. Māori account for about 14% of the labor force, whereas Pasifika account for roughly 6%.
Changing labor market dynamics
The GFC clearly had relatively long-lived effects on employment, participation, and employment rates overall, as well as for particular subgroups. The post-GFC labor market also differs in terms of job and worker flows. In recent years, there have been consistently lower rates of hires and separations than before the GFC. As illustrated in Figure 4, the trend rate of hires each quarter was close to 18% of employment before the GFC. This dropped to below 14% in 2009, and despite recovering somewhat and peaking briefly in 2018, has remained mostly between 15% and 16%, even though the labor market has absorbed record high levels of immigration. Perhaps more surprisingly, the rate of separations also declined markedly after the onset of the GFC, presumably reflecting a decline in voluntary quits that more than offset a rise in involuntary separations. Although the drop was not as sharp as for hires, dropping by about 3 percentage points, the separation rate is currently below its pre-GFC levels. Lower rates of worker turnover reflect greater stability of employment for employees, but may also signal reduced flexibility in the labor market, with less reallocation of workers to more productive or better-matched jobs. As expected, the impact of the Covid-19 lockdown and the associated wage subsidy support was to sharply reduce hires and separations, both of which were over 2 percentage points lower in the third quarter of 2021 than they were before the lockdown.
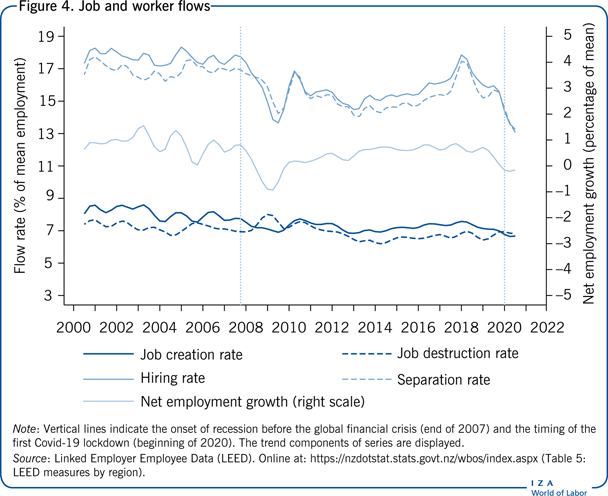
The post-GFC changes in job creation (employment growth in expanding firms) and job destruction rates (employment declines in contracting firms) also indicate a decline in labor market liquidity and reallocation, exacerbated by the Covid-19 lockdown. The job creation rate has remained lower than it was pre-GFC and has fallen by 0.8 percentage points since early 2018. The job destruction rate is at a similar level to what it was pre-GFC, having risen sharply in 2009 before dropping to historically low levels by 2014. The modest rate of employment growth from 2010 to 2019 thus occurred despite a lower rate of new job creation or new hires.
Wage developments
There has been moderately strong growth in real wages since 2000, amounting to an increase of 31% by 2021, or about 1.4% per year, above the OECD average of just under 0.9%. The pattern of growth in real (adjusted by the Consumer Price Index) median hourly earnings is shown in Figure 5 together with indicators of earnings dispersion.
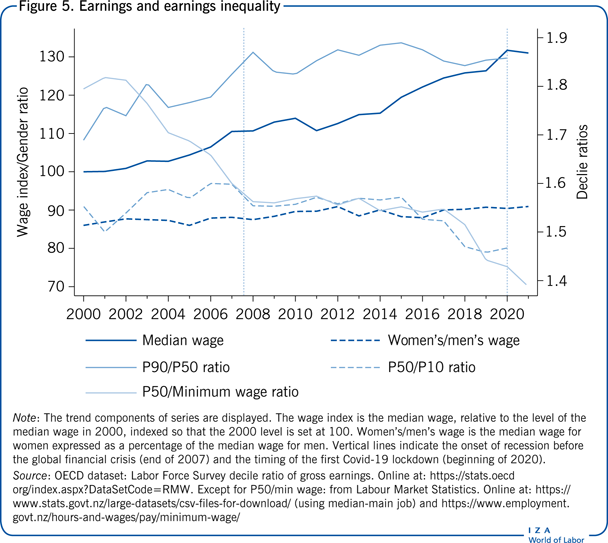
Wage dispersion, as measured by the ratio of the 90th percentile to the 10th percentile of the wage distribution, rose between 2000 and 2015, due to increased dispersion in the upper half of the distribution. Dispersion in the lower half of the distribution was relatively stable over this period. Overall, the 90th percentile of the wage distribution was 2.62 times the 10th percentile in 2000, rising to 2.97 times in 2015. In contrast, since 2015, that ratio has fallen sharply to 2.73, but is still higher than it was in 2000. The post-2015 change is due mainly to a pronounced compression in the lower half of the wage distribution. The ratio of the median to the 10th percentile dropped from 1.57 in 2015 to 1.47 in 2020.
Figure 5 also shows changes in the ratio of median hourly earnings to the minimum wage. This differential has declined from over 1.8 in the early 2000s to below 1.4 in 2021. This reflects substantial increases in the statutory minimum wage, which has been roughly equal to the 10th percentile since 2006. The 2021 minimum wage increase to NZ$20 raised the minimum wage to a historically high 72% of the median wage. There has also been compression in the lower half of the wage distribution above the level of the minimum wage—in part reflecting pay equity claims that were settled with care and support workers from 2017, and with teacher aides from 2020. Together these claims affected the pay of around 80,000 workers, disproportionately women.
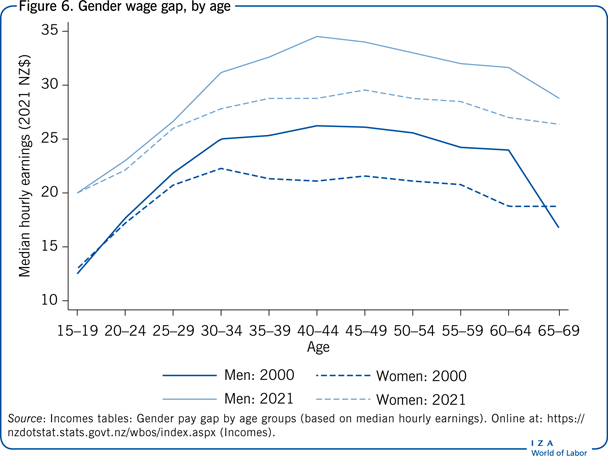
The gender wage gap has declined slightly since 2000. Median hourly earnings for women were 86% of those of men in 2000, rising to almost 91% by 2021. The gains for women were concentrated in the downturn between 2009 and 2012, when men experienced slower wage growth, including a larger real decline than women in 2011. The gender gap remains high, however, for older workers. As shown in Figure 6, the gender gap is close to zero up until about age 30, and increases until ages 40–44, when median earnings for women are just under 85% of men’s. Beyond the age of 45, the median wage for men declines more rapidly than for women, compressing the gender wage gap. Although both men and women have experienced real wage increases at all ages, wage growth has been particularly strong among men aged 40–59, leading to slightly smaller declines in the gender gap at those wages. Overall, however, the gender gap declines by 1 to 7 percentage points for each age group above 25–29.
Underpinning the overall growth in wages was a rise in average capital per worker, as well as improvements in labor quality. Aggregate productivity statistics suggest that about 60% of the overall 21% growth in labor productivity since 2000 has been due to a rise in the amount of capital per worker. However, this almost all occurred before 2010. Since then, almost all labor productivity growth has been due to multifactor productivity growth rather than changing capital per worker. The rise in worker qualifications has also been significant. Between 2000 and 2021, the proportion of employed workers with university degree qualifications (ISCED levels 5A and 6) rose substantially—from 13% to 35% of employment. In contrast, those with no qualifications accounted for only 12% of employment in 2021, compared with 20% in 2000. The changes in employment shares continue the process of qualification upgrading that has been evident for several decades. Census data from 1986, which are indicative but not completely comparable with the figures given above, show the share of workers with degrees at around 8% and the share of employed people with no qualifications at around 37%.
Figure 7 summarizes the joint evolution of employment shares and wage levels for three broad qualification groups. Although New Zealand's growth in qualifications has been strong, tertiary qualifications in New Zealand include an unusually high proportion of short-cycle (two- to three-year) tertiary qualifications, and a low share of qualifications at Master's level and above [5]. The number of tertiary qualified people among the 25- to 34-year-old population is also low compared with other countries.
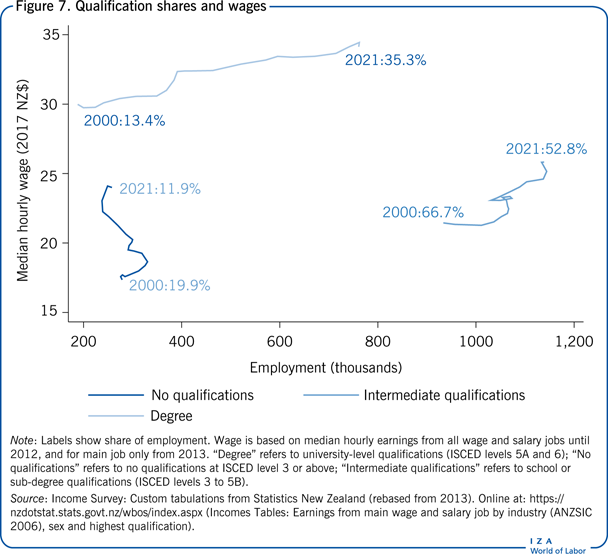
Furthermore, educational wage premiums are relatively low in New Zealand, and have declined substantially since 2000. The median hourly wage for degree-qualified workers was NZ$34.13 in 2021, only 26% above the median for workers with no qualifications (NZ$27.03). This premium has declined since 2000, when it stood at 73%. Between 2000 and 2021, the wage increase for degree holders (13.8%) was much smaller than that of unqualified workers (38.3%), and was also lower than that of workers with intermediate (ISCED levels 3 to 5B) levels of qualification (20.4%). The erosion of the skill premium is perhaps unsurprising given the strong growth in the number of employed degree-holders, although the same erosion is not always evident in countries that have experienced similar growth in the relative supply of skilled workers. Movements in median earnings may also understate the skill premium facing any particular worker. The change in median earnings for more highly qualified workers will be lowered by the entry of less-experienced workers earning less than the previous median. The relatively strong growth in earnings for lower-skilled workers also reflects the earnings compression shown in Figure 5.
Regional labor markets
Not all regions within New Zealand have followed the national pattern of labor market changes. Two regions in particular have had notably different experiences—Auckland and Canterbury. Auckland is the largest city in New Zealand, accounting for around one-third of the national population. It attracts a disproportionate share of international immigrants, and also has higher rates of natural increase than other regions. Employment growth in Auckland was faster than average before the 2008 downturn. Despite experiencing a relatively large and long drop in employment between late 2008 and mid-2010, it has subsequently rebounded, and has had stronger than average growth between 2007 and 2021. Auckland employment grew by 37.4% compared with an average growth rate of 25.8%.
In contrast, the labor market in the Canterbury region was profoundly affected by the major earthquakes that hit the city of Christchurch in September 2010 and February 2011. Employment in this region declined by 5.5% in 2011. There was strong growth during the recovery and rebuild, although it was not until mid-2013 that Canterbury regained its pre-earthquake level of employment. There was a strong contraction in employment in 2018, as construction activity slowed. Growth has since resumed, but Christchurch employment growth since 2007 (23.7%) is still below the national average.
Limitations and gaps
The main limitation of this analysis is the lack of very recent data to capture the fast-changing impacts of the continuing Covid-19 pandemic. The effects of the lockdowns in the final quarter of 2021 are not reflected in the data presented here. The New Zealand labor market in 2022 and beyond will show the ongoing impacts of the pandemic and New Zealand's substantial efforts to raise vaccination rates.
More generally, the analysis is limited by the coarseness of the disaggregation of data, which doubtless masks significant variation. Additionally, changes in the classifications of qualifications, ethnicity, and industries in official statistics during the 2000−2019 period restrict more detailed analysis. Finally, there is limited publicly available data on wage inequality to provide detailed analysis of the wage compression that is documented in Figure 5.
Summary and policy advice
Heading into 2020, the New Zealand labor market had recovered from the GFC, with high employment rates, low unemployment rates, and moderately strong real wage growth. There had been equity gains, with a reduction in the gender gap, and relatively strong wage growth for low-paid workers. The impacts of the Covid-19 pandemic are clearly evident in the trends documented above. Employment rates are high and unemployment rates low, in part due to the closing of the borders, which have temporarily suppressed immigration-related growth in the working-age population. There is uncertainty about the continued impacts of Covid-19 on the labor market while New Zealand, like many countries, continues to balance economic and public health priorities. In the short-term at least, there will be a continued need for financial support for Covid-19-affected businesses and workers.
This article identifies some longer-term underlying tensions that provide challenges for labor market policies into the future. The compression of wages in the lower half of the wage distribution has achieved some gains in equity, which has been an explicit policy goal in recent years. The compression has, however, led to a compression of skill differentials, with implications for education and skills policies.
There are a number of pay equity claims currently being considered, including for nurses and midwives, and a broad range of public sector, health, and educational staff. These are likely to result in further wage compression, as will any further increases in minimum wages above historically high levels. The current government has announced its intention to introduce legislation on “Fair Pay Agreements” in 2022, which could significantly strengthen the role of industry- and occupation-level collective bargaining. The impacts of this are however uncertain, as a legislative Bill is yet to be introduced.
The Covid-19-related closure of the borders has brought the issue of immigration policy into sharp relief. The government has announced an immigration policy “reset,” and the NZ Productivity Commission is currently working on an inquiry into immigration policy. Any changes to immigration policy will have important impacts on labor supply and skills policies in the coming years.
Acknowledgments
The author thanks Dean Hyslop, Corey Allan, and the IZA World of Labor editors for helpful suggestions that have improved this article. Version 2 of the article updates the text and figures to 2021, including the effects of Covid-19 on the labor market.
Competing interests
The IZA World of Labor project is committed to the IZA Code of Conduct. The author declares to have observed the principles outlined in the code.
© David C. Maré