Elevator pitch
Might the Belgian labor market be included in the gallery of “Belgian surrealism”? At first sight, Belgium with its 11 million inhabitants has withstood the Great Recession and the euro area debt crisis relatively well, quickly getting back on track toward growth and employment, apparently without rising earnings inequality. But if one digs a little deeper, Belgium appears to be a strongly segmented labor market, first and foremost in an astounding north–south regional (linguistic) dimension. This extreme heterogeneity, along with several demographic challenges, should serve as a warning for the future.
Key findings
Pros
By the end of 2016, employment was about 5% higher than its pre-Great Recession level.
The unemployment rate for women has been trending downward since 2005.
There is no clear-cut rise in earnings inequality.
The gender pay gap is shrinking.
Cons
Over the 2000–2016 period, the unemployment rate has trended upward.
The north–south unemployment rate gap remains huge.
Youth unemployment is far above the adult average, in particular for the low-skilled and foreign-born.
In 2016, the labor force participation rate remained well below the EU15 average, especially for people aged 55 and over.
Real earnings have hardly increased since 2000, and the incidence of poverty among the unemployed has risen in the last decade.
Author's main message
Several standard labor market indicators suggest that Belgium has mostly recovered from the Great Recession, and has done so without experiencing increased inequality. However, these trends have been accompanied by government wage controls, a slight decline in real disposable income, and a rise in poverty among the unemployed. Notwithstanding improvements in the average position of women, the labor market continues to be plagued by several long-term problems. Among these, mass youth unemployment, a high incidence of long-term unemployment, and low participation rates among older people present a real threat to social cohesion and economic development.
Motivation
This case study of Belgium illustrates that geographical unemployment clusters largely ignore national boundaries. In addition, this is not a temporary phenomenon. These observations question standard analyses of the causes of unemployment, which take the country as the unit of observation and stress that the poor design of national labor market institutions is the culprit for bad labor market performances. Access to employment is also persistently difficult for several subgroups in Belgium. Making the labor market more inclusive definitely remains a daunting challenge.
Discussion of pros and cons
Aggregate issues
Figure 1 shows the time paths of real GDP, aggregate employment, and the aggregate unemployment rate in Belgium from 2000 onwards. The first two aggregates are derived from the national accounts, while the unemployment rate is based on harmonized Eurostat—the European Statistical Agency—data. The three indicators are provided on a quarterly basis.
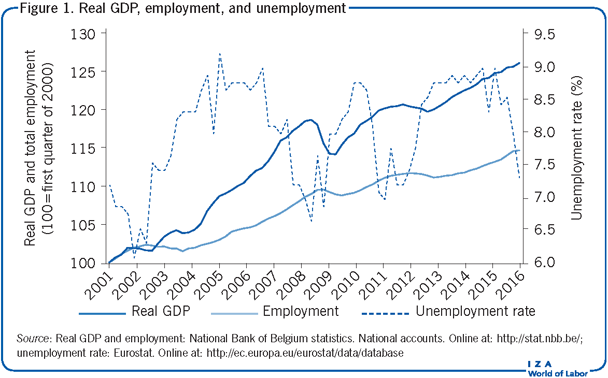
The Belgian economy experienced a short recession from the second quarter of 2001 to the end of 2001. During that recession, real GDP contracted by just 0.3% and the unemployment rate increased slightly, from 6.1% of the labor force in March 2001 to 7.4% in December 2001. During the subsequent six-and-a-half-year recovery, the unemployment rate kept on rising. It peaked at 8.7% of the labor force in April 2006, its highest level over the whole 2000–2016 period. The aggregate unemployment rate then fell steadily and returned to 6.6% of the labor force just before the Great Recession.
The Great Recession lasted from the third quarter of 2008 to the second quarter of 2009. Over that period, Belgian real GDP contracted by 3.8%. Despite this strong decline in real GDP, the immediate impact on unemployment was relatively mild thanks in particular to short-term work arrangements: from 6.6% of the labor force in June 2008, the aggregate unemployment rate only rose to 7.8% at the trough of the recession. However, the unemployment rate continued to increase at a moderate pace after the Great Recession, and only started to decline in the third quarter of 2010.
The decline in unemployment in 2011 was at least partly driven by a strengthening of the job search requirements in the Belgian version of the Eurostat labor force survey (LFS) (resulting also in a decline in the participation rate). During the euro debt crisis of 2012–2013, the contraction of GDP was less severe than during the Great Recession. However, the unemployment rate increased more strongly, from 7.1% of the labor force in March 2012 to a peak of 8.5% in April 2013. It then remained steady at around 8.5% until mid-2015. From that date, aggregate unemployment declined slowly. By the second quarter of 2016, it was down to 7.2% of the labor force.
Between 2000 and 2016, labor productivity rose by about 10%, which explains why employment increased at a lower trend rate than real GDP (see Figure 1). During recessions, employment declines lagged behind the fall of aggregate output. For the 2001 recession as well as the Great Recession, the lag in Belgium was two quarters, while it was one quarter during the 2012 euro area debt crisis. By mid-2010, employment exceeded its pre-Great Recession level. By the end of 2016, it was 5% higher than before the Great Recession.
The time pattern of hours worked (by salaried workers) between 2000 and 2016 is very close to the time pattern of employment. In 2016, the number of total hours worked was 2.5% higher than at its peak before the Great Recession, while salaried employment increased by 3.5%.
Beyond cyclical variations, the evolution of the unemployment rate from 2000 to 2016 exhibits a clear upward trend. The minimum values of the indicator tended to rise over time, from 6.1% in the first quarter of 2001 to 6.6% in the second quarter of 2008 and 6.9% in the second quarter 2011. This stair-step evolution of Belgian unemployment is, however, much less pronounced than the one observed in the 1980s and 1990s [1]. It is too early to determine whether the recent economic recovery will reverse this worrisome longer-term tendency of Belgian unemployment.
Long-term unemployment (defined by Eurostat as the number of unemployed people who have been out of work and actively seeking employment for more than 12 months) is particularly high in Belgium, especially when compared to other OECD countries. Between 2000 and 2016, the ratio of long-term unemployment to total unemployment averaged 49%, with a maximum of 55.4% (in 2000) and a minimum of 44.2% (in 2009). It increased significantly after the Great Recession and after the euro area debt crisis. In 2016, long-term unemployment amounted to 51.6% of total unemployment.
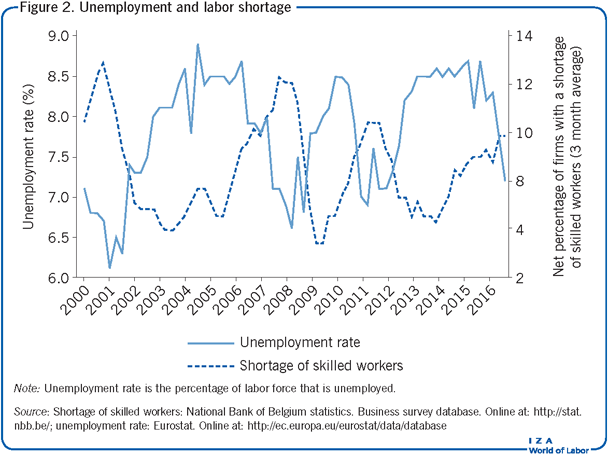
Figure 2 shows the net percentage of manufacturing firms that declare they face a shortage of skilled workers. Its cyclical pattern is clearly inversely related to the cyclical pattern of the aggregate unemployment rate. The shortage of skilled workers fell sharply during the Great Recession. It increased thereafter, but declined again during the 2012–2013 euro area debt crisis. Since the end of 2013, it has been on an upward path. By the end of 2016, it was clearly above its historical average (6.2% over the period 1980–2007), but still below its pre-Great Recession level. The rapid increase in the number of manufacturing firms reporting difficulties in finding suitably skilled workers when unemployment is only starting to decline suggests that part of Belgian unemployment is structural.
Labor force participation—Aggregate, by gender, and by age
Figure 3 shows the labor force participation rate in Belgium for those aged 15–64. Over the period 2000–2016, the participation rate has slightly risen by 2.5 percentage points to reach a level of 67.6% in 2016, which is well below the EU15 (those countries that were EU members prior to the accession of ten countries in 2004) average (73.9%). However, this aggregate trend hides disparities across gender. The participation rate for women aged 15–64 increased from 56.4% in 2000 to 62.9% in 2016. Since the participation rate of men aged 15–64 has tended to decrease, the gap in participation between men and women has narrowed over the past 16 years, from 17.3 to 9.4 percentage points.
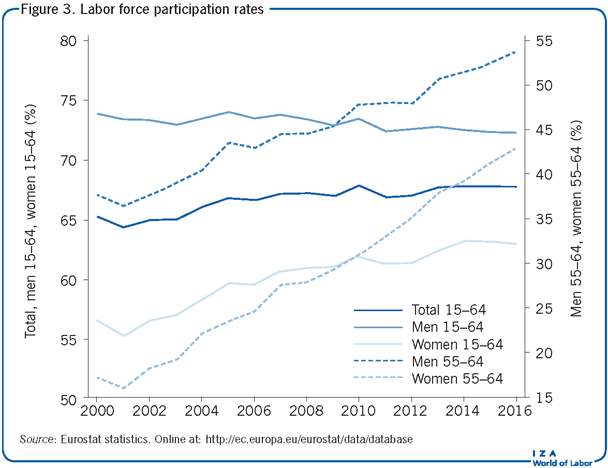
The challenge posed by population aging to the welfare systems of many countries is well-known. In this respect, Belgium is particularly exposed because of policies introduced between the 1970s and 1990s fostering early retirement [2]. According to Eurostat statistics for 2000, the labor force participation rates of men and women aged 55–64 were respectively equal to 37.5% and 17.1% in Belgium, while they were equal to 51.6% and 30.3% on average in the EU15. By 2016, the situation had improved, with a participation rate of 53.6% for men and 42.8% for women in Belgium compared to, respectively, 68.4% and 54.7% on average in the EU15 countries. Despite these recent improvements and the stepwise increase in the legal retirement age of women from 62 in 2000 to 65 in 2009, the average effective age of labor market exit in Belgium remains low: 60.0 for men and 59.3 for women [3].
The demographics of unemployment—Age, gender, and region
Among adults aged 25 or over, the rising pattern of Belgian unemployment is only seen for men. For this group, the unemployment rate rose from 4.5% in 2000 to 7.0% in 2016. The unemployment rate for women has moved in the opposite direction since 2005, even falling below the male unemployment rate in the last four years (see Figure 4). Part of this evolution may be related to the implementation of a service voucher system, which has boosted women’s employment opportunities in services (e.g. household help; see “Employment developments” below).
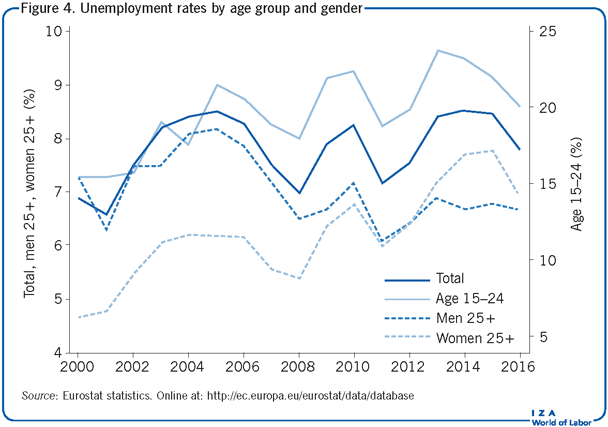
As in many countries, youth unemployment is a major concern in Belgium, in particular for the low educated (below upper-secondary school) [4] and the foreign-born (from outside the EU28). In 2016, the youth unemployment rate (under 25 years old) in Belgium was as high as 20.1% (21.7% for men and 18.2% for women). It peaked at 33.8% for low-educated youth, which was more than double that of the highly educated (15.1%), and at 37.2% among foreign-born young people. Since the turn of the century, youth unemployment has also trended upward (see Figure 4), an increase that only came to a halt for women in 2005, probably also related to the aforementioned system of subsidized vouchers for service work.
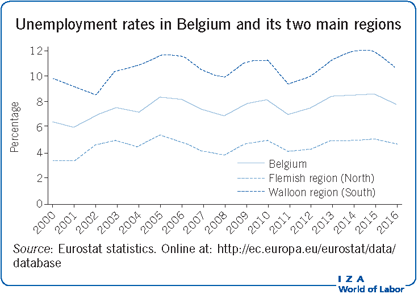
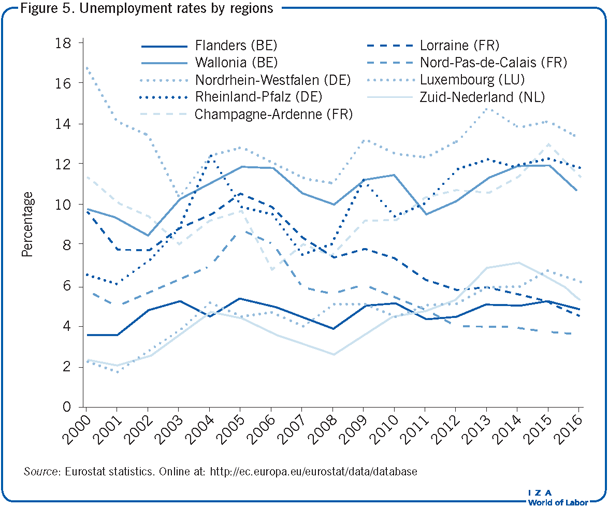
Belgium is a federal state comprising two main regions: Flanders, a Dutch-speaking region in the northern part of the country, and Wallonia, a primarily French-speaking region in the southern part. Compared to Flanders, GDP per capita was 27% lower in Wallonia in 2013. A third region, Brussels, is actually a city, and for that reason is not comparable with the other two regions. Its unemployment rate peaked at 16.8% in 2016. Due to space limitation, Brussels will not be specifically mentioned any further. However, it should be said that its upward trend in unemployment is a major matter of concern.
Figure 5 compares unemployment rates in Flanders and Wallonia to those of neighboring regions across the Belgian border. As indicated previously, the tighter job search requirements introduced in the Belgian survey in 2011 might influence subsequent Belgian indicators. In terms of unemployment from 2000 to 2011, Wallonia is typically found in second place when ranking the worst performing regions. Only the Nord-Pas-De-Calais region in France is in a less favorable position. In 2016, Nord-Pas-De-Calais still positioned first (i.e. worst, at 13.3%), followed by two other French regions, namely Lorraine and Champagne-Ardennes, with the Walloon region trailing close behind (11.8%, 11.3%, and 10.5%, respectively). By contrast, with an unemployment rate of 4.8% in 2016, Flanders is among the best performing regions in the area, together with the South Netherlands region and the extreme west of Germany.
In 2016, there were 390,000 unemployed people in Belgium according to International Labour Organization (ILO) criteria. In addition to this, according to Eurostat, 80,000 jobless people were available for work, but were not actively looking for a job, and another 53,000 were looking for jobs, but were not immediately available for work. If one includes these jobless people who do not fulfill all the ILO criteria for being unemployed, the Belgian unemployment rate would rise from 7.9% to 10.3%.
The large number of non-employed people (above school-leaving age and under pension age) in a number of countries (including the US) has raised some concerns about how well the unemployment rate—even in its broader concept—measures available labor [5]. In 2016, the share of the Belgian population aged 25–64 that reported not working (at least one hour a week in return for payment) was as high as 29.1%, against 26.6% on average in the EU15. This is the result of a relatively low activity rate, particularly for seniors, and an unemployment rate still well above its frictional level (i.e. the level due to people being temporarily unemployed when they move between jobs or look for a first one). It is also worth noting that one-quarter of Belgian youth aged 25–29 were not employed in 2016 (a share similar to the EU15), the large majority of them not being in education, employment, or training (the so-called “NEETs”).
Employment developments
Figure 6 displays the sectoral pattern of employment since 2000. The share of people working in construction was pretty stable over the period, hovering around 5.5% of total employment. By contrast, industrial employment’s share of total employment has decreased steadily over the period. At the end of 2016, it was about 14%, far below its 2000 level (about 20%). Conversely, the share of employment in services has risen steadily, reaching 80.5% of total employment in 2016. A large part of this increase occurred before the Great Recession. After 2004, employment in technical and support services increased rapidly. It was sustained by the so-called “titres-services” system, a service voucher scheme that was introduced in 2001 by the federal government but became truly effective only in 2004. The scheme is based on tax deductible vouchers that households can purchase at a fixed price and which they can use to pay for personal services (e.g. house cleaning, domestic help, garden maintenance, and home cooking). It is estimated that, between 2004 and 2016, this scheme led to the creation of about 175,000 jobs [6], [7].
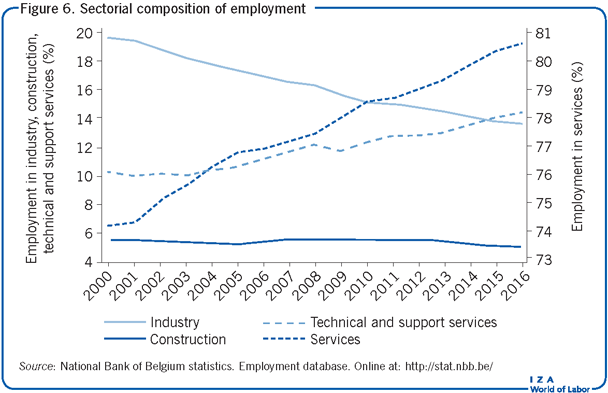
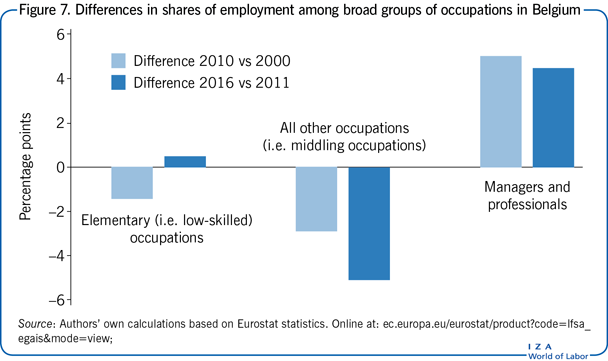
Figure 7 provides evidence that the polarization of jobs was not clear-cut during the first decade of the 21st century, since the shares of both elementary (i.e. low-skilled) and middling (non-managerial/professional and not low-skilled) occupations shrank. From 2011 to 2016, some polarization seems to have occurred, since the share of middling occupations declined sharply, while the share of the other two groups increased [8].
According to the EU LFS, the share of fixed-term contracts in total employment has been fairly stable throughout the period (around 8% to 9%), higher but declining for women and increasing for men. Among the population aged 15–29, this share has been much higher and growing for both genders since 2013 (amounting to 22% for men and 27% for women at the end of 2016). Furthermore, the share of part-time jobs in total employment has increased since 2000 for both genders (amounting to 10% among men and 42% among women in 2016).
Wage developments
Figure 8 presents two different measures extracted from national account data. Wages and salaries (in cash or in kind) include basic pay, regular and irregular overtime, and bonus payments made to employees. Household disposable income includes all revenues received by households, plus transfers and social benefits, minus taxes on income and wealth and social security contributions paid by employees. To get a proxy of individual earnings, wages and salaries are divided by the number of employees, while aggregate disposable income is divided by the total population. Furthermore, each variable is expressed in real terms by deflating its nominal value by the overall consumer price index (CPI), and both series are normalized to 100 in 2000.
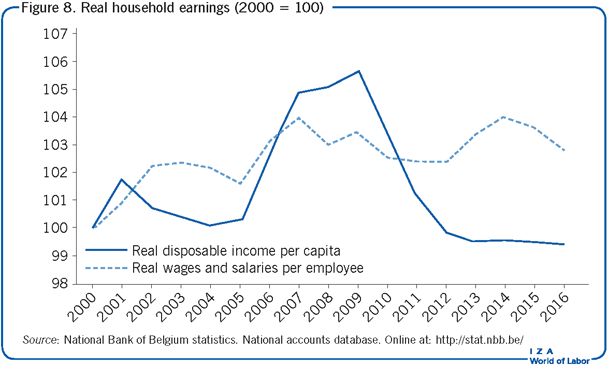
In Belgium, nominal private sector wages are indexed on a specific CPI and their growth is limited across the board by a maximum fixed by the social partners or the government at the national level. After a peak in 2007, real wages and salaries declined until 2012. They reached a new peak in 2014 but were again falling in 2015 and 2016. Over the whole period, the total increase in real wages and salaries was positive, but it amounted to a very modest rate of 3%. As far as real disposable income is concerned, it increased rapidly between 2005 and 2009, but, due to a sustained higher growth of consumer prices, it declined very strongly afterwards. As a consequence of this sharp fall, by the end of 2016, it was slightly below its 2000 level.
Earnings inequality and poverty
Measures of earnings inequality in Belgium are based on the Structure of Earnings Survey. This survey covers establishments of at least ten employees, but excludes some sectors, such as agriculture and public administration. It provides information on gross monthly earnings of full-time wage earners. Data include those premiums that are paid every pay period, like bonuses for night or weekend work, but ignore other premiums and advantages in kind (e.g. company cars). Given these characteristics, this source is clearly far from ideal to measure wage inequalities. According to OECD data, over the available period (2000–2014) and among men, standard ratios P90/P10 (the wage at the 90th percentile divided by the wage at the 10th percentile), P90/P50 (the wage at the 90th percentile divided by the median wage) and P50/P10 (the median wage divided by the wage at the 10th percentile) fluctuate without any clear trend, respectively around 2.4, 1.8, and 1.4. Among women, the magnitude of the three ratios is on average very similar. However, the trend is slightly positive (i.e. increasing inequality) in the case of P90/P50 and more recently also of P90/P10.
According to Eurostat and on the basis of the Structure of Earnings Survey, the gender pay gap (based on hourly earnings) in Belgium has shrunk from 10% in 2007 to 7% in 2015. The gender gap in annual labor income among 18–64 year olds also declined between 2005 and 2014 (from 48% to 33%) [9].
The risk of poverty, defined as having less than 60% of the national median equalized disposable income, amounted to about 5% in 2016 among the employed and looks rather stable. Among the unemployed, however, it amounted to 46% in 2016, with an upward trend since the Great Recession.
Limitations and gaps
Belgian labor market data suffer from some general shortcomings. First, there is no easy access to individual labor force data. Second, statistics on labor market flows are very imperfect (and hence have not been mentioned here). Third, the data available to measure changes in inequality among workers are unsatisfactory.
Summary and policy advice
Despite significant improvements since the Great Recession and the euro area debt crisis, the Belgian labor market’s situation remains problematic. On average in 2016, 7.8% of the labor force was still unemployed, half of these for more than 12 months. It also appears that the aggregate unemployment rate has been on an upward trend since 2000, with women being a notable exception. In spite of the small size of the country, (un)employment rates are extremely varied, first and foremost in a north–south regional (linguistic) dimension. This fact, the large share of long-term unemployment and the high unemployment rate among young low-skilled or minority workers point to a highly segmented labor market. A number of problems plaguing the Belgian labor market are shared with other EU countries, the primary one being mass youth unemployment. Others, such as the relatively low employment rate of older people, seem more Belgium-specific.
Heavily indebted, often blocked by a complex institutional architecture, and facing the necessity to meet several demographic and ecological challenges, Belgian authorities find themselves pushed to the wall with very few innovative solutions on hand. Historically, policymakers in Belgium have indeed paid limited attention to analyzing the causes of unemployment problems and to evaluating the impact of the various policies put in place. The lack of innovative solutions is at least partly explained by this insufficient level of investment.
Acknowledgments
The author thanks the IZA World of Labor editors for many helpful suggestions on earlier drafts.
Competing interests
The IZA World of Labor project is committed to the IZA Guiding Principles of Research Integrity. The author declares to have observed these principles.
© V. Bodart, M. Dejemeppe and B. van der Linden