Elevator pitch
Since 1991, the Australian economy has experienced sustained economic growth. Aided by the commodities boom and strong public finances, the Australian economy negotiated the global financial crisis without falling into recession. Over this period there were important structural changes, with increasing labor force participation among the elderly and the continuing convergence of employment and unemployment patterns for men and women. However, some recent negative trends include a rise in unemployment, especially long-term unemployment, a deteriorating youth labor market, and a stagnant gender earnings gap.
Key findings
Pros
Australia has not experienced a recession since 1991, leading to strong growth in employment and lower unemployment rates.
Labor force participation of men and women aged 55–64 has increased.
Real average earnings of full-time workers have increased.
Following rising income inequality from the late 1970s to 1990, inequality has remained relatively stable since 2000.
Cons
Despite sustained economic growth, long-term unemployment has increased over the past decade, returning to the relatively high levels of the early 2000s.
Teenage workers face limited labor market opportunities.
The long-term growth in real weekly earnings has been modest.
There has been remarkably little improvement in the gender earnings differential since 2000.
Author's main message
The Australian labor market has performed remarkably well over the 2000–2016 period. With the benefits of the commodities boom, unemployment declined, while participation rates and real average earnings grew. Despite the generally positive outlook, rising long-term unemployment, limited youth labor market prospects, excessive income growth among the top earners, and stagnant gender earnings differentials are all causes for concern. Policymakers could attempt to address these issues via taxation and transfer policies to moderate growth at the very top of the income distribution while promoting it toward the bottom of the income distribution.
Motivation
Reliable and timely information on labor market developments is critical for understanding developing trends and highlighting emerging problems that require appropriate policy responses. Considering the performance of national labor markets in an international context can help identify the institutions, policies, and circumstances that account for the experiences of a specific country. This article documents key features of the performance of the Australian labor market over the period 2000–2016.
Discussion of pros and cons
Aggregate issues
The Australian economy has experienced an enviable record of a quarter of a century of economic growth. From the third quarter of 1991 through to the end of 2016, the Australian economy experienced recession-free growth despite the economic shocks associated with the Asian financial crisis of 1997–1998, the 2001 US stock market crash, and the global financial crisis of 2008–2009. Over this period, the Australian economy grew at an average annual rate of 3.2%.
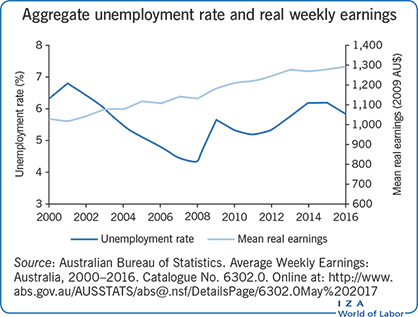
Against the background of sustained output growth, cyclical factors were evident in the labor market. Figure 1 charts the (seasonally adjusted) aggregate unemployment rate series from 2000 to 2016. During this period, the unemployment rate peaked in 2001 at 6.8%. Sustained economic growth led to a progressive decline in unemployment to 4.3% of the labor force in 2008, with the economy being close to full employment. Despite technically avoiding a recession (defined as two consecutive quarters of negative real GDP growth) following the onset of the global financial crisis, there was a marked increase in the unemployment rate to 5.7% in 2009, which then stabilized around 5.2% from 2010 to 2013. This was followed by a further weakening of the labor market, associated with the end of the commodities boom and reduced mining investment, which saw the unemployment rate increase to 6.2% in 2014–2015. Although the unemployment rate was lower on average over the 2000–2016 period than the preceding three decades, the pattern of a sharp rise followed by a prolonged period of higher unemployment is typical of Australia’s postwar experience.
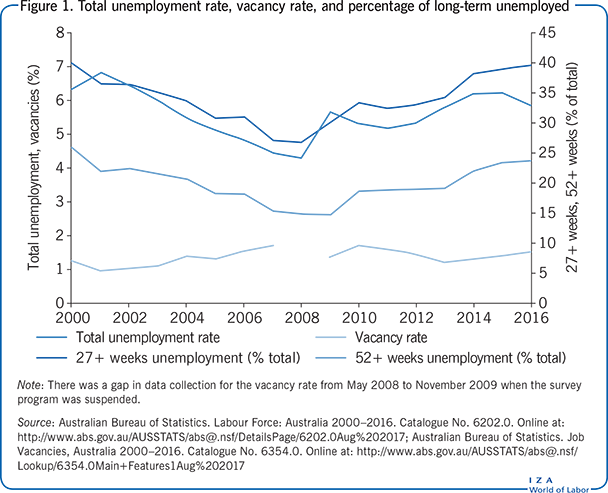
Since the early 1990s, the Australian Bureau of Statistics (ABS) has collected information on job vacancies through a quarterly survey of Australian businesses. There was a gap in collection from May 2008 to November 2009 when the survey program was suspended. Figure 1 charts the aggregate job vacancy rate, which is the number of recorded vacancies expressed as a percentage of vacancies plus employees, across all industries in November of each year the survey was conducted. The vacancy rate is a crude measure of unmet labor demand and as such is a useful counter-cyclical indicator. Over the 2000–2016 period, the vacancy rate largely mirrored the aggregate unemployment rate series. After a brief decline in 2001, the vacancy rate increased from 2002 until the break in the series in 2008; it then rose from 2009 to 2010, dropped from 2010 until 2013, before rising again in more recent years.
Underlying the relatively low level of aggregate unemployment and dampened cyclical fluctuations are significant labor market disparities. Long-term unemployment is an enduring feature of the Australian labor market. From 2000 to 2008, the incidence of long-term unemployment, defined as being out of work and actively seeking it for 27 or more weeks, declined from 40% to just over one-quarter of the unemployed. The incidence of very-long-term unemployment, defined as being unemployed and actively seeking work for over one year (more than 52 weeks), fell over the same period from 26% to 15%. The weakening of the labor market in 2008 saw a reversal of this trend, with both long- and very-long-term unemployment rising over the past decade, eventually returning to the high levels of 2000–2001. The high, and rising, incidence of long-term unemployment indicates that the burden of unemployment is increasingly concentrated among specific sections of society.
Labor force participation—Aggregate, by gender and age
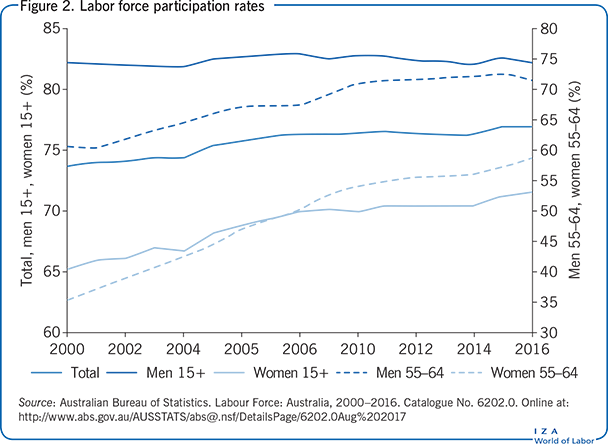
Figure 2 shows the total Australian labor force participation rate since 2000. Over this period, the fraction of the population aged 15–64 years (either in employment or unemployed) has grown from 73.8% to 76.9%. The growth in aggregate participation is due to increasing participation among women, which has risen from 65% to 72%, while participation among men has remained stable at around 82%. The trends in participation rates are not uniform across age groups. The rise in participation rates is most pronounced among elderly individuals aged 55–64 years, which increased from 35% to 59% and 61% to 72% among women and men, respectively. In contrast, among 15 to 19-year-old Australians, participation rates fell from 59% to 56% and 58% to 51%, respectively, for men and women. Overall, the past two decades witnessed the continuing convergence in labor force participation rates for men and women.
The demographics of unemployment—Age and sex
There are important differences in the incidence of unemployment across demographic groups in Australia. Like many countries, unemployment is especially high among teenagers. As shown in Figure 3, in the early 2000s unemployment among 15 to 19-year-olds was around 16.5%, compared to 6.5% for the total labor force. During the period of sustained growth up to 2008, unemployment declined across all groups, although the relative decline was less among the youngest. The slowdown in activity associated with the financial crisis led to an increase in unemployment among all demographic groups. However, this increase was most accentuated among teenagers, and since 2010 the teen-to-adult unemployment ratio has exceeded three. Combined with declining teen participation rates, there has been a clear deterioration in the labor market prospects of teenage workers over the past decade.
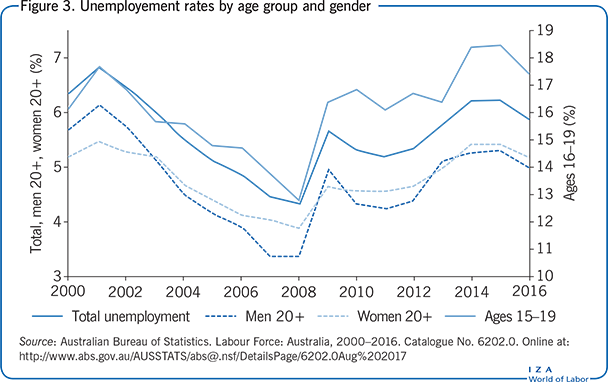
The path of adult male and female unemployment rates generally follows the aggregate series. Historically, male unemployment has fluctuated more over an economic cycle, as the cyclical sensitivity of female participation dampens variation in the female unemployment rate series (i.e. a larger proportion of women leave the labor force during downturns, or enter it during booms, thus reducing the observed impact on unemployment). Typifying this pattern, the male unemployment rate declined more than the female rate during the period of strong economic activity leading up to the financial crisis in 2008. However, as observed in many countries, there has also been a secular rise in female participation rates, and since 2010 the adult unemployment rates for both genders have tracked closely together.
Earnings developments
Aggregate statistics on average weekly earnings are derived from an ABS survey of employers, with the sample drawn from businesses registered with the Australian Tax Office. The series covers wage and salary earners and records their weekly compensation in the most recent pay period. The adjustment for inflation is made using the all items Consumer Price Index (CPI).
Two series for real average weekly earnings are shown in Figure 4. The series are real weekly earnings and real weekly full-time ordinary earnings. Changes in the former may be due to variations in average real compensation, average hours worked per week, or both. Changes in average hours worked per week (for example, due to the changing incidence of full- and part-time employment) distorts this as a measure of hourly compensation when making comparisons across groups at a point in time, or for a group over time. A superior measure that more closely approximates hourly compensation is the series on real weekly full-time ordinary earnings. This series is based on full-time employees (35+ hours per week) and excludes overtime payments during the reference pay period. Although this concept does not completely remove work hours variation from the series, it substantially adjusts for differences in weekly labor usage.
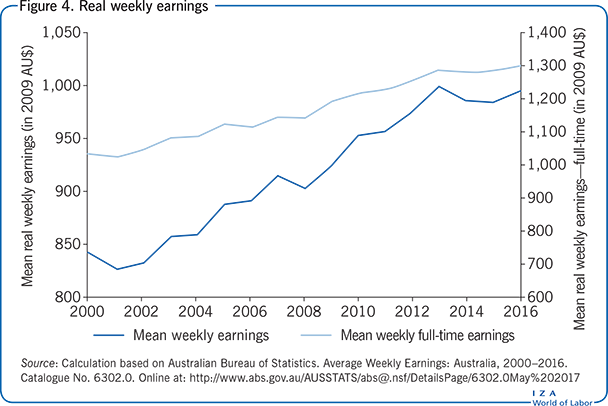
As evident from Figure 4, both series increased over the 2000–2016 period. The average annual growth rates were 1.04% and 1.44% for mean weekly and mean full-time ordinary earnings, respectively. The lower average rate for mean weekly earnings reflects the growing share of part-time work in total employment over this period. Although the average growth in mean full-time ordinary earnings is higher, given the sustained expansion of the aggregate economy over the past quarter of a century, the gains in mean earnings have been modest. Indeed, the Reserve Bank of Australia has recently cited the moderate growth in mean earnings as a concern [1].
Female–male earnings differences
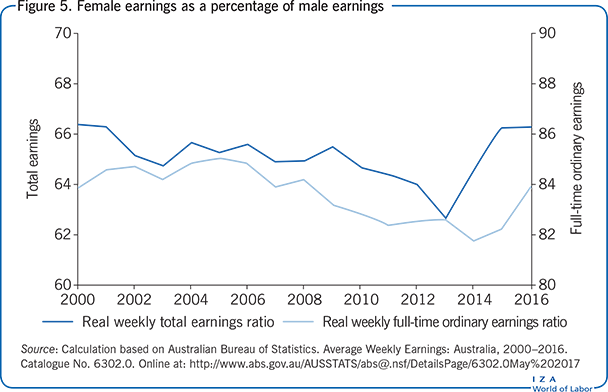
It is important to consider trends in earnings for different groups in the labor force. Figure 5 presents the mean female weekly earnings as a percentage of male weekly earnings. Series for both mean total earnings and mean full-time ordinary earnings are shown. The relative mean total earnings series varies between 62.4% and 66.4%, and the relative mean full-time ordinary earnings series varies between 81.8% and 85.5%. The most remarkable feature of this graph is the relative stability, and lack of improvement, in the gender mean earnings differential since 2000.
Changing income inequality
When examining social welfare, it is important to consider aspects of the distribution of earnings or income. The ABS does not publish statistics on weekly earnings beyond the mean. However, it does conduct household survey programs that measure a range of income concepts, for which distributional measures are published. This subsection focuses on the welfare concept of household disposable (post-tax, post-transfer) income, equivalized for household size and composition (based on the OECD adult equivalence scale).
Figure 6 presents simple and informative descriptive measures of inequality by showing the ratio of earnings at different income distribution percentiles. The calculated ratios include the 90/50, 80/50, 50/20, 50/10, and 90/10 ratios. The figure presents the time series for these distributional measures for equivalized household disposable income for the period 1999/2000–2015/2016 (split years are shown because the survey covers fiscal years, i.e. July–June).
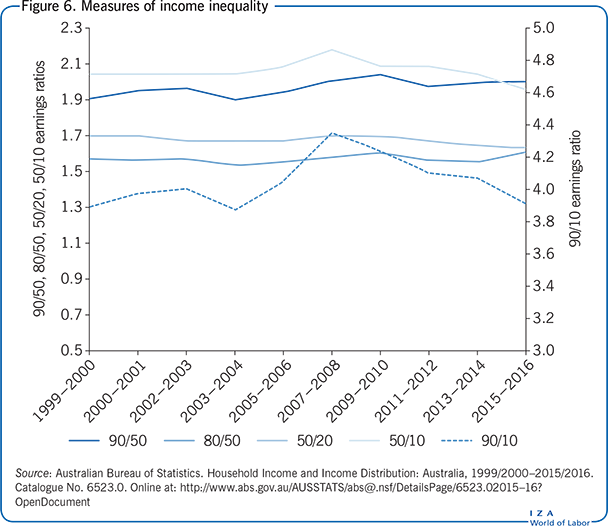
As in most industrial economies, there has been a significant increase in Australian earnings and income inequality since the late 1970s [2]. However, a distinguishing feature of Australia, as evidenced in Figure 6, is the relative stability of income inequality since 2000. In particular, the 90/50, 80/50, 50/20, and 50/10 ratios remain generally flat over the 2000–2016 period. These measures highlight that the household income distribution has remained largely stable. The exception is the 90/10 ratio, which rose throughout the period of strong economic growth up to 2008, and has declined since. This exception can be attributed to the rapid increase in household incomes at the very top percentiles, as has been the case in many other countries. Indeed, recent research based on Australian administrative tax data reveals that the most rapid rise in income shares has occurred within the top percentile [3].
Immigrant earnings differences
Australia is a land of immigrants, with over 28% of the population born overseas as of June 2016 [4]. An important and long-standing component of Australian immigration policy is the intake of “skilled migrants,” where entry is determined by a points-based assessment of work-related skills. Given the prevalence of immigration and the economic focus of immigration policy, it is useful to consider the labor market outcomes of immigrants relative to their Australian born peers.
Figure 7 presents the ratio of average weekly earnings of immigrants relative to Australian born workers from 2000 to 2014. The ratio is calculated for full-time (35+ hours per week) workers. On average, immigrants appear to be compensated well in the Australian labor market, with a mean weekly earnings ratio of 102% over the 14-year period. The annual figures tend to fluctuate around the mean, with no long-term trend. Considering gender groups separately, female immigrants working full-time do not fare as well as male immigrants, relative to their Australian-born peers.
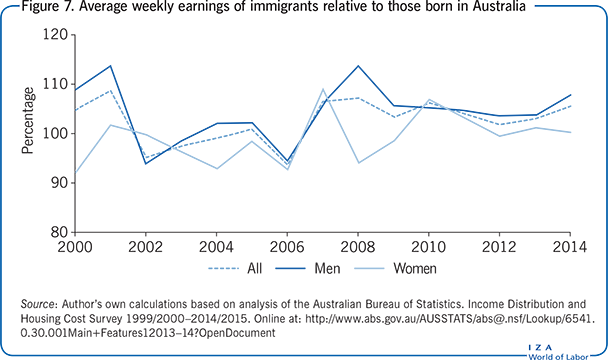
These earnings ratios reflect a positive outcome for immigrants in the Australian labor market. However, this should not be overinterpreted, as several caveats must be considered. First, when looking at all workers (part-time plus full-time), the immigrant earnings ratios fluctuate pro-cyclically, suggesting that immigrants’ work hours are more sensitive to the business cycle. Second, the raw earnings figures do not account for skill differences, which is particularly pertinent given Australia’s migrant policy of targeting skilled workers. Third, broad earnings aggregates mask significant differences by language (especially whether English is the first language), experience, occupational attainment, and years since migration. Further, the earnings comparisons do not account for differences in employment prospects by immigrant status and attributes. Indeed, there is an established literature that analyzes the economic integration of immigrants in Australia; it reports that immigrants face significant wage gaps, conditional on skills and other observable characteristics [5].
Limitations and gaps
The most important limitation of Australian labor market data is in the provision of detailed and consistent information on the distribution of earnings and income. High-quality information is collected and disseminated by the ABS on labor force status by detailed demographic groups. However, there is a paucity of information on earnings beyond mean weekly earnings by gender. This makes it more challenging to track contemporary distributional developments, especially for detailed demographic groups, such as youths and the elderly, the native-born and immigrants, or by broad skill attainment levels. This gap in fundamental evidence introduces a time lag in policy development.
Summary and policy advice
The Australian economy and labor market have performed remarkably well over the previous two decades, with sustained output and employment growth, reduced unemployment, and higher real earnings. At the same time, there has been a secular increase in the labor force participation of the elderly, especially elderly women. There is a continuing role for public policy to promote and support increasing participation at older ages, as this activity contributes to national production while reducing stress on income support programs.
One clear drawback to the overall success of the labor market is that economic prosperity has not been equally shared. The burden of unemployment is concentrated among specific sections of the labor force. The recent weakening of the labor market, due to slower economic growth following the end of the commodities boom, has seen the incidence of long- and very-long-term unemployment return to the relatively high levels experienced in 2000–2001. Developing effective labor market policies to address the problems of long-term unemployment remains an important priority for policymakers.
Finally, there is a relative paucity of detailed and timely data on the earnings and wages of Australian workers. Enhancing the monthly Labour Force Survey with questions on earnings would help bridge this major gap in basic knowledge. Based on the information available, since 2000, earnings growth has been moderate and the gender earnings gap has not improved. It also appears that household income inequality has remained stagnant during this period, while recent evidence indicates substantial growth among the very top income shares. Taxation and transfer policies are thus important instruments for addressing income inequality, by curbing excessive growth at the very top of the income distribution and improving the progressivity of the system.
Acknowledgments
The author thanks an anonymous referee and the IZA World of Labor editors for many helpful suggestions on earlier drafts. The author further thanks Kadir Atalay for helpful comments and the ARC for financial support.
Competing interests
The IZA World of Labor project is committed to the IZA Guiding Principles of Research Integrity. The author declares to have observed these principles.
© Garry Barrett