Elevator pitch
Good policy requires reliable scientific knowledge, but there are many obstacles. Most econometric estimates lack adequate statistical power; some estimates cannot be replicated; publication selection bias (the selective reporting of results) is common; and there is wide variation in the evidence base on most policy issues. Meta-regression analysis offers a way to increase statistical power, correct the evidence base for a range of biases, and make sense of the unceasing flow of contradictory econometric estimates. It enables policymakers to develop evidence-based policies even when the initial evidence base lacks credibility.
Key findings
Pros
Meta-regression offers a systematic scientific approach to research synthesis and quantitative review of the evidence base.
Meta-regression methods can be used to formally test hypotheses and rival theories.
Meta-regression is particularly useful for explaining sources of the wide variation in reported econometric estimates.
Meta-regression can correct the evidence base for specification bias and reduce the effects of publication selection bias.
Involving simple regression analysis and standard software, with well-established guidelines and protocols, meta-regression is easy to implement.
Cons
Identifying relevant studies and extracting and coding the data needed to conduct meta-regression analysis is very labor intensive.
Inexperienced coders can make coding errors, thereby biasing estimates.
Researcher bias in making modeling choices can negatively affect meta-regression analysis just as it can affect primary data analysis.
Meta-regression methods are less effective for research areas in which there are only a handful of econometric studies.
Author's main message
To formulate effective labor market interventions, policymakers need reliable estimates of key relationships. Yet the reported evidence cannot be taken at face value. Most empirical studies report an excessively wide range of estimates, and some of the evidence base is missing from the public record because of publication bias. Traditional evidence reviews are vulnerable to subjective interpretation, potentially distorting policy conclusions. Policymakers should encourage meta-regression to provide systematic reviews of the evidence and enable testing of theory and correction of biases that afflict reported econometric estimates.
Motivation
Evaluation of key parameters commonly take the form of thousands of econometric results. How does one make sense of the multitude of diverse and frequently conflicting estimates of key elasticities? On which estimates do decision-makers base policy? Are some estimates more reliable than others? What is prudent policy when some part of the evidence base is missing from the public record?
A credible summary of the evidence needs to be comprehensive and objective, be based on statistically valid methods, identify and correct bias in the reported evidence base, and account for diversity in the empirical findings. Traditional narrative reviews of the empirics cannot satisfy all of these criteria. Narrative reviews select a non-random portion of the evidence, cannot offer statistical inference, and are vulnerable to the subjective interpretations of the reviewer. Nor can they use statistical methods to identify, correct, or reduce biases embedded in the evidence base. Fortunately, meta-regression analysis methods offer a practical solution.
Discussion of pros and cons
The rationale for meta-regression
Whether related to the minimum wage, unionization, the value of a statistical life, immigration, childcare, training, or any of hundreds of other issues, evidence-based policy needs to build on credible information. Most reviewers of an evidence base assume that the research record is composed of unbiased estimates from which valid inferences are easily made. Consequently, the typical approach is to review a non-random sample of estimates, often those drawn exclusively from leading journals. This approach delivers an unbiased assessment only if the reviewed studies are representative of the entire evidence base and only if the leading journals report unbiased and reliable estimates. However, the evidence base reported in leading journals is far from ideal. Indeed, leading journals are subject to publication selection bias (leaving some of the evidence base unreported because the estimates are not statistically significant or because they do not conform to researchers’ expectations), and there is a worrying inability to replicate key results [2]. The situation in other journals is no better. Fortunately, researchers in fields as diverse as medicine, psychology, and economics have long been aware of these concerns and have developed meta-analysis methods to deal with them.
Meta-regression has two main advantages. First, in contrast to traditional reviews, it offers a scientific approach to research synthesis by attempting to survey systematically and comprehensively the entire evidence base. Second, meta-regression can detect and correct biases in the literature. The first motive stands alone from the second; even without bias correction, meta-regression offers a more comprehensive and less slanted research synthesis than narrative reviews, and thus a sounder base for policy assessment.
Dubbed the regression analysis of regression analyses, meta-regression can be used to summarize the evidence base, identify sources of heterogeneity, increase statistical power, correct or reduce publication selection bias, and reveal new associations. A brief description of these tasks follows.
Summarizing the evidence base
Meta-regression methods synthesize the research record by calculating a weighted average of comparable reported effect sizes (meta-average), such as elasticities or partial correlations. These meta-averages can be unconditional or they can be conditional on a range of moderating factors. The statistical significance of the meta-average often reveals the existence of an underlying association, while the economic (or practical) significance of the meta-average reveals the magnitude of a key value of interest (parameter), which makes it central to policy effectiveness.
Sampling and estimation errors can create the appearance of divergence in empirical findings. By combining all estimates on a relationship of interest, meta-regression analysis effectively removes any net effect of sampling error from empirical findings. Reported estimates on a given topic cannot be assumed to be of equal value, because some estimates are reported with greater precision. Thus, it is necessary to calculate a weighted average of the pooled estimates, assigning more weight to more precisely estimated values. Common weights used are the inverse variance of the reported elasticity, number of citations a study has received, journal impact factor, sample size, and other indices of quality. A smaller variance means a higher precision of the estimated association. Hence, inverse variance weights give more precise estimates a larger weight in the meta-regressions.
Meta-averages can also pool estimates within individual studies as well as from different studies. For example, studies reporting a very large number of estimates could calculate a weighted meta-average of all the empirical findings. This would make it easier for policymakers and other reviewers to efficiently extract information from such primary studies.
Identifying the source of heterogeneity
A striking and salient feature of empirical economics research is excess heterogeneity. Studies report a seemingly endless array of often conflicting findings. Which result is correct? In which findings should policymakers place more trust? Just as regression analysis is necessary when labor market phenomena are multifaceted, so too is meta-regression necessary when research findings are multifaceted. Meta-regression identifies the source of heterogeneity in reported findings. This may be intrinsic to the phenomenon studied, as when a key elasticity varies by gender, age, industry, or nation, or varies over time. However, heterogeneity is often found to be an artifact of research choices, such as model specification, functional form, the exact data sampled, or the estimator employed. All these sources of heterogeneity can be identified through meta-regression.
Increasing statistical power
Statistical power is a critical element of credible research. Empirical studies have adequate statistical power when they can detect a genuine empirical effect; this requires low rates of false negatives (predictions that are true but are predicted as false). A survey of 159 meta-regression analyses of some 6,700 empirical studies in economics found that such research is greatly underpowered: statistical power in economics is typically no more than 18% (compared to the ideal of 80%), with almost half of the 159 empirical economics areas surveyed having 90% or more of the reported results from underpowered studies [2]. Meta-regression analysis increases statistical power by combining the results from numerous underpowered studies. This reduces the standard error of the weighted average effect size and thus reduces confidence intervals around the weighted average and thereby increases the likelihood of detecting a genuine empirical effect.
Correcting or reducing publication selection bias
A simple summary of the evidence base is usually insufficient for informing policy. It has long been suspected that reported econometric estimates are an unrepresentative sample of all the estimates that have been calculated. That is, reported estimates have been selected from a much larger number. Harry Johnson, a renowned Canadian economist, famously quipped that the “‘testing of hypothesis’ is frequently merely a euphemism for obtaining plausible numbers to provide ceremonial adequacy for a theory chosen and defended on a priori grounds” [3], p. 92. Self-interest can be assumed to operate in the market for ideas as surely as it does in any other market. Motivated by the incentives of academia, many researchers may report results consistent with their prior understanding or academic aspirations. Even if only a small proportion of researchers is so motivated, this can be sufficient to muddy the waters of the research record and potentially give a distorted picture of policy effectiveness.
There is now much evidence that selective reporting of econometric estimates is a widespread problem—some might say it is verging on an epidemic. For example, the survey of 159 economics topics found empirical economics to be highly contaminated by selection bias, with a majority of the reported effects exaggerated by a factor of at least two, conservatively estimated [2]. It goes without saying that such artificial inflation of elasticities has major repercussions for perceived policy effectiveness.
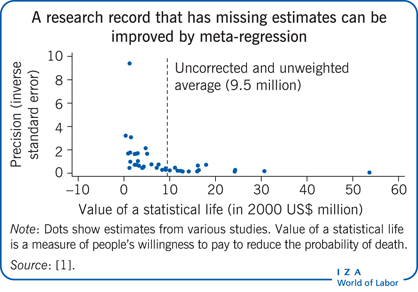
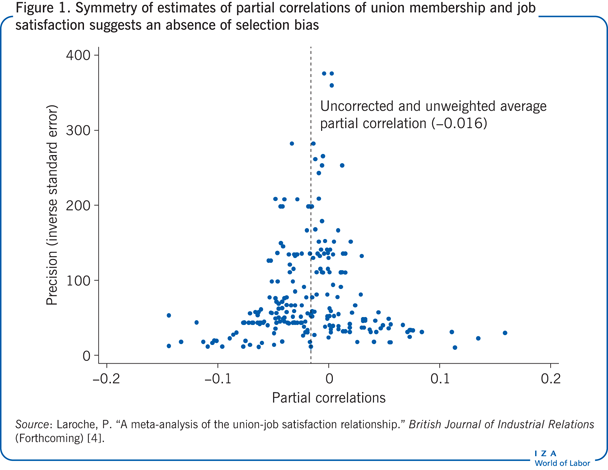
Funnel plots offer an informative, yet simple, way of illustrating the heterogeneity and potential selection bias of reported estimates. These scatter diagrams are typically constructed with the reported elasticity on the horizontal axis and some measure of precision (e.g. the inverse of standard error) on the vertical axis. If, as in Figure 1’s display of estimates of a partial correlation of union membership with job satisfaction, there is no publication selection bias, the funnel plot should be symmetrically distributed around the average elasticity. In contrast, publication selection bias means that some of the evidence is missing, which results in a truncated plot. Thus, the Illustration shows an asymmetrical distribution of estimates of the value of a statistical life (the amount of money people are willing to pay to reduce the probability of death), with values truncated at zero, instead of being spread symmetrically around a specific value. This truncation is generated by research design choices [1]. For example, measurement and sampling error can give negative values when the value of a statistical life is relatively small. Eliminating these values from the research record truncates the distribution and consequently artificially inflates estimates of the average value of a statistical life. Thus an asymmetrical funnel plot is suggestive of selection bias, although in some distributions the asymmetry may be natural and unrelated to bias, reflecting, for example, underlying variations in estimates over time or across groups.
Revealing new associations
By combining the findings of different studies, meta-regression analysis can take unique advantage of variation across estimates to investigate new associations. For example, meta-regression analysis is commonly used to investigate time variation in estimates. Since primary econometric studies often draw on samples at different points in time, the meta-analyst can explore time variation in elasticities even when the original studies do not. An investigation of the association between CEO pay and performance in the UK, for instance, found erosion over time in the effectiveness of “comply-or-explain” policy rules, which allow companies that do not comply with certain rules to explain why instead [5]. The time variation in reported estimates can reflect many phenomena. It might reflect structural change in the underlying economic associations but it might also reflect research design choices; for example, different empirical methodologies over time. Or it might reflect changes in reporting preferences, with researchers in earlier studies preferring to report larger effects and researchers in subsequent studies reporting smaller effects, giving the impression of declining effects. Thus, time variation may be a signal to delve more deeply into the empirical literature.
The meta-analyst can also investigate other contextual associations. For example, estimates from studies can be matched with income levels or labor market regulations, or some other dimension, at the time the samples were taken. Once again, this may enable investigation of hypotheses not considered in the primary studies, and these investigations may result in new theoretical propositions.
The meta-regression model
The meta-regression model is a fairly conventional multiple regression model. The dependent variable is an estimate of a parameter of policy interest—for example, the elasticity of labor supply with respect to childcare prices, the correlation between training and innovation, rates of return to education, and the gender pay gap. These estimates are known as the effect size in the meta-regression analysis literature. The meta-analyst collects all comparable estimates of the effect size and then explains the variation in reported effect sizes by regressing them on a set of explanatory variables. In most cases, estimates from credible unpublished studies (such as National Bureau of Economic Research working papers) will also be included in the meta-regression analysis. The meta-regression model can be used to quantify the effect on reported estimates of the parameter of interest of differences in data, specification, measurement, and types of estimators.
An important explanatory variable in the meta-regression model is the standard error of the reported elasticity, which is a measure of the accuracy of the estimated effect. Including this variable creates the funnel-asymmetry–precision-effect test, which can be used to identify and correct publication selection bias [6]. The logic behind this test is that in the absence of selective reporting there should be no correlation between an estimated elasticity and its standard error. Detection of such a correlation suggests the presence of publication selection, meaning that the primary researchers were searching for statistically significant estimates and preferentially reporting estimates that met this requirement. However, it is important to point out that the meta-regression’s corrected estimates do not depend on this publication selection bias interpretation. Regardless of the cause of an association between an estimate and its standard error (e.g. small-sample bias), driving the standard error to zero is always statistically preferable. The smaller the standard error, the more accurate and reliable the estimate, all else being equal.
Other explanatory variables can be used to model heterogeneity in the meta-regression model and to quantify the impact of model misspecification. For example, explanatory variables can be included that capture best practice in the specification of the econometric models. Typically, econometric specification is modeled in the meta-regression using binary variables. These variables indicate the type of control variables included in the econometric studies. The coefficients on these binary variables reveal specification bias. The meta-analyst can then “correct” the effect of misspecified studies rather than discarding these estimates and losing all of the associated information on other research dimensions. The preferred strategy is to include all estimates in the meta-regression, formally test whether specification differences affect reported results, and base policy recommendations on best practice.
The explanatory variables typically consist of information derived predominantly from the primary econometric studies. However, as noted above, explanatory variables can be constructed using information from outside the research studies themselves in order to explore dimensions that were not examined in the primary studies, such as time variation, country variation, and regulatory and income differences.
The estimated parameters of the meta-regression model can be used to derive conditional estimates of the average effect size—estimates of the average effect size conditional on moderating factors. These conditional estimates can then be used to inform policy. Thus, when suitably constructed, the meta-regression model can be used to correct for misspecification and publication selection bias, to model heterogeneity, to increase statistical power, and to assist with the development of effective labor market policies.
Some applications
There are now numerous applications of meta-regression analysis in labor economics, including studies of immigration, active labor market policies, the minimum wage, and the employment impact of labor market regulations, among many others [7], [8], [9], [10]. Two areas that have drawn several meta-regression analyses are estimates of the value of a statistical life and the employment impact of the minimum wage. These are reviewed briefly below.
The value of a statistical life
Estimates of the value of a statistical life are an important input into the cost–benefit analyses of public health, transportation, and environment programs. Several meta-regression analyses have estimated the value of a statistical life. For example, one meta-regression analysis of 39 wage equation estimates that synthesized the evidence base and analyzed heterogeneity in reported values arrived at a simple average value of a statistical life of $9.5 million (in 2000 US dollars) [11]. However, the possibility of publication selection bias cannot be discounted in this or in any of the rest of the literature because all literature is vulnerable to selective reporting.
The funnel plot of the value of a statistical life shown in the Illustration is asymmetric. However, selection bias is not the only reason why funnel plots may not be symmetrical. Sometimes the reason is simply underlying heterogeneity, for example, because the value of a statistical life may vary over time and across groups. The only way to confirm selection bias is through formal statistical tests. One meta-regression analysis shows that the literature on the value of a statistical life likely suffers from publication selection bias [1]. Consequently, averages of reported values will present an exaggerated measure of the value of a statistical life. A study using meta-regression corrections for publication selection bias derived a corrected value of a statistical life of $2.74 million, a significant difference from the uncorrected average of $9.5 million [1]. A recent meta-study that revisited this debate using data from the US Census of Fatal Occupational Injuries also found statistically significant publication selection bias [12]. However, these data produced significantly higher values of a statistical life, ranging from $7.6 million to $11.0 million. The study concluded that “there is no basis for reducing the [value of a statistical life] amounts currently used for policy based on publication selection effects.”
Employment effects of the minimum wage
The impact of the minimum wage on employment is one of the more hotly contested income redistribution and labor policy issues of the day. Reported econometric estimates vary considerably, but the unweighted average suggests an adverse employment effect. Several meta-regression analyses have investigated this literature. Using recent methods for detecting and correcting publication selection bias and a large sample of 1,474 estimated minimum-wage elasticities, one study found only publication selection bias and no economically significant employment effect for the US [6]. An update of this meta-study confirmed the earlier findings of no adverse employment effect [9]. An investigation of the minimum wage in the UK found no publication selection bias and also no economically significant employment effect, except for a small adverse effect in the homecare industry [13]. On the other hand, a meta-regression analysis of the much smaller minimum wage literature for developing countries found some adverse employment effect after correction for publication selection bias [10]. Thus, meta-studies have largely confirmed, though with a few exceptions, that the minimum wage has not had an adverse effect on employment.
Limitations and gaps
Why pool the econometric estimates from diverse studies? Why not just pool all the data and conduct one large and well-developed credible econometric model? The simple answer is that there will never be a situation where the only evidence comes from one big study on any given topic. There will always be more to learn from another, perhaps even larger study. Perhaps there is an alternate specification or an alternate functional form that needs to be tested or additional data become available, a new estimator is developed, or a new theory requires testing. Science never stops. Researchers have an incentive never to stop. As the evidence base mounts, so does the need to make sense of the accumulating data and econometric estimates. Once again, policymakers will need to resort to some method of research synthesis.
A common criticism of meta-regression analysis relates to the comparability of estimates— a “mixing of apples and oranges” problem. This issue is exhaustively discussed in the meta-analysis literature. The short answer is that meta-analysis requires comparable estimates. All meta-analysis guidance makes this very clear. Meta-analysts must be careful to collect a comprehensive, comparable, and unbiased collection of estimates. There are many more requirements for conducting rigorous and replicable meta-analyses too numerous to discuss here. Critics who disagree on the choice of studies included in any given meta-analysis are free to conduct their own independent meta-analysis, if they can justify the objectivity of alternative rules for inclusion or exclusion. Moreover, if some part of the evidence base is not comparable, this does not reduce the need for research synthesis of the remaining, comparable estimates. Meta-analysts may introduce bias if they exclude parts of the evidence base for reasons other than lack of comparability. (See, for example, the discussion of bias in the estimates included in the meta-regression analysis of the value of a statistical life [1].) The preferred approach is to highlight only the meta-regression findings that are robust to all such justifiable variation in how effects are measured. For example, the finding that there is no economically significant adverse employment effect from raising the minimum wage has been clearly shown to be independent of how the effect is measured.
The main challenge in conducting meta-regression analysis is the time and skill needed to construct the full set of comparable estimates from a research record. This is the costliest part of the analysis. The meta-regression analysis itself is no more complicated than any other applied econometric analysis; standard statistical software can be used to estimate the meta-regression model using weighted least squares. An associated issue is that some subjectivity may be involved at times in coding information from the primary studies. Some primary studies provide insufficient clarity on the data used, the variables included in the estimated models, or how key variables were measured. This lack of clarity can result in ambiguity in coding variables to be included in the meta-regression. Where there is ambiguity, a second and perhaps third coder is essential to resolve disagreements. In some cases it may be possible to contact primary authors, but this is often difficult or even impossible.
Another issue is that while meta-regression analysis reduces subjectivity in analysis, it does not eliminate it. For example, while the literature provides some guidance, there are usually numerous dimensions that can be coded, such as which control variables, data characteristics, and contextual variables to code and include in the meta-regression. Meta-analysts need to decide which dimensions should be coded, as meta-regression models can quickly run out of degrees of freedom (the number of values in a calculation that the analyst can vary).
A further challenge in using meta-regression arises when reviewing an emerging literature with only a small number of studies. Meta-regression offers rather limited advantages (such as increased objectivity and replicability) in this situation and is unlikely to settle all the potential issues. Here, more standard narrative reviews, when balanced and insightful, are probably more beneficial in directing future research.
Summary and policy advice
Demand for credible estimates is escalating. A scientifically valid approach to research synthesis is essential. Meta-regression analysis offers a unique methodology for seeing through the mist that often surrounds empirical economics and should be an indispensable part of good policy development. It can increase statistical power, correct the evidence base for a range of biases, and make sense of the flood of econometric estimates. While meta-regression has its own nuances and demands, it is relatively straightforward to conduct. With dozens of examples to follow and well-established guidelines and protocols (such as the MAER-Net and PRISMA guidelines), most economic researchers should be able to conduct meta-regression analysis.
There is currently a sharp focus on the credibility of empirical research, and some initiatives have been offered to alter incentives and practices. Nevertheless, at least for the foreseeable future, it can be assumed that some self-interested researchers will continue to report a selected sample of estimates. The good news is that because methods are available to correct the evidence base, this valuable information already in the public domain does not need to be discarded. And even if corrections for bias were to become unnecessary and estimates could be taken at face value, formal hypothesis testing and explanation of systematic heterogeneity would still be required. In any case, as practices improve, there will always be a need for objective synthesis that renders empirical research intelligible and identifies practical policy implications. Policymakers can encourage meta-studies and consider their findings when formulating policies.
Acknowledgments
The author thanks two anonymous referees and the IZA World of Labor editors for many helpful suggestions on earlier drafts. Previous work of the author contains a larger number of background references for the material presented here and has been used intensively in all major parts of this article [1], [6], and Stanley, T. D., and H. Doucouliagos. Meta-Regression Analysis in Economics and Business. Oxford: Routledge, 2012.
Competing interests
The IZA World of Labor project is committed to the IZA Guiding Principles of Research Integrity. The author declares to have observed these principles.
© Chris Doucouliagos