Elevator pitch
Work hours are key components in estimating productivity growth and hourly wages as well as being a useful cyclical indicator in their own right, so measuring them correctly is important. The US Bureau of Labor Statistics (BLS) collects data on work hours in several surveys and publishes four widely used series that measure average weekly hours. The series tell different stories about average weekly hours and trends in those hours but qualitatively similar stories about the cyclical behavior of work hours. The research summarized here explains the differences in levels, but only some of the differences in trends.
Key findings
Pros
On average, respondents to the US BLS's household survey correctly report weekly hours worked per person and weekly hours worked on their main jobs.
All series exhibit similar cyclical behavior.
Differences in levels between the longest-running series (Current Population Survey (CPS), Current Employment Statistics (CES) production and nonsupervisory workers, and Office of Productivity and Technology (OPT )) can be explained by differences in concepts and coverage.
These three series exhibit similar trends since the beginning of the 1990s (all four since 2007).
Hours measured in different countries’ labor force surveys can be compared after adjusting for differences in survey reference periods.
Cons
Significant differences exist between the longest-running series in levels and trends; differences in long-term trends cannot be completely reconciled.
In the household survey, respondents under-report multiple jobholding and over-report hours worked on second jobs; still, aggregate hours are approximately correct because these errors mostly offset each other.
Estimating annual work hours from average weekly hours overstates the annual number of hours worked, since the surveys’ reference periods exclude most holidays.
Hours worked as recorded in national income accounts across different countries are difficult to compare because of differences in data sources.
Author's main message
The BLS publishes four widely used weekly-hours series: one from its household survey (CPS), two from its establishment survey (the CES production-worker and all-employee series), and one that combines data from the two (OPT). The difference in level between these series can be explained by survey features, but the difference in long-term trends can be only partially explained. However, all four series tell qualitatively similar stories about the cyclical behavior of weekly work hours. It is important for decision makers to understand the advantages and limitations of the different hours series.
Motivation
Measuring weekly work hours correctly is important for estimating average hourly earnings and labor productivity. If average weekly hours are overestimated, then average hourly wages are underestimated. To illustrate, some research using US data has shown that college graduates tend to overestimate their hours, while high school graduates tend to slightly underestimate theirs [1]. This imparts a downward bias on the average hourly wage of college graduates and an upward bias on the average wage of high school graduates, thus underestimating the college–high school wage difference. For measuring productivity, the actual number of hours worked is not as important as the growth rate. Most countries compare the growth in output to the growth in total labor hours (average weekly hours × employment × number of weeks per period). If hours growth is underestimated, then productivity growth will be overestimated.
Average weekly hours is also an important economic indicator in its own right. Firms can adjust work hours more easily than employment levels. Thus, at the beginning of a recession, firms historically have reduced hours per worker before laying off workers. Similarly, at the end of a recession, firms are often uncertain about the strength of the recovery and tend to increase hours per worker before incurring the cost of hiring additional workers.
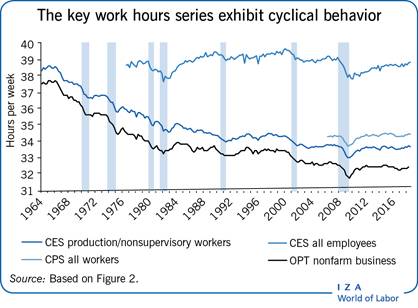
The average weekly hours series from the US Bureau of Labor Statistics’ (BLS) main sources of data on hours have both similarities and differences (Illustration). Average weekly hours for all workers from the household survey (the Current Population Survey (CPS)) have the highest level and exhibit a relatively flat trend—hovering around 39 hours a week but with a fair bit of cyclical variation. In contrast, weekly hours for production and nonsupervisory workers drawn from the establishment survey (the Current Employment Statistics (CES)) are lower in level, have less cyclical variation, and exhibit a strong downward trend until the early 1990s, with most of the decline occurring before 1982. The establishment survey's all-employee series behaves much like the production and nonsupervisory worker series, but is slightly higher in level. The BLS's Office of Productivity and Technology (OPT) private nonfarm business hours series, which is derived from the establishment survey production worker series combined with data from the household survey and the National Compensation Survey, behaves much like the establishment survey production worker series. This is not too surprising since the production worker series is its primary data source.
Another source of data on work hours is the American Time Use Survey (ATUS). The BLS publishes estimates of time spent working, but does not publish an official hours series. It is discussed here mainly because researchers have used microdata from time-use surveys to assess the quality of hours data from household surveys. The behavior of this series is similar to that of the hours series from the household survey.
Discussion of pros and cons
This section discusses the results of research that has examined the differences in these series with the goal of helping policymakers evaluate these important economic data. The series have different strengths and weaknesses, which need to be taken into account in deciding which to use.
A brief description of the hours series
The CPS is a monthly survey that collects information about employment status and hours worked from a sample of 60,000 households each month. Respondents are asked about usual and actual hours worked on their main and secondary jobs. For actual hours worked, respondents are usually asked to report for the week that includes the 12th of the month, which was chosen to minimize the effect of holidays. However, the November and December survey reference weeks are sometimes moved to the week of the 5th due to the impact of the November and December holidays on data collection or survey operations. These individual monthly reports are averaged to arrive at an estimate of average weekly hours worked. Although the survey collects hours worked on each job separately, the published estimates are on a per-employed-person basis.
The CES survey collects information, also monthly, from business establishments on employment and hours paid for the pay period that includes the 12th of the month. Until recently, the establishment survey collected hours data only for production workers (in goods-producing industries) and nonsupervisory workers (in services-providing industries); the series derived from these data is referred to as the production worker series. In 2006, the BLS started publishing an all-employee average weekly hours series in addition to the production worker series. The establishment survey production worker series has a much longer time series and it was the official hours series of the BLS until 2010, when the all-employee series became the official series. The two establishment survey series move together, but the all-employee hours series is higher in level by about three-quarters of an hour per week compared to the production worker series, which implies that average weekly hours are about 3.5 hours greater for nonproduction and supervisory workers than for production and nonsupervisory workers (nonproduction and supervisory workers are about 20% of total employment in the establishment survey).
As in the household survey series, average weekly hours from the establishment survey are calculated as total hours divided by total employment. However, because employment in the survey is establishment based, the denominator is the total number of jobs rather than the total number of employed people. Thus multiple jobholders are counted once in the household series but multiple times in the establishment survey. There are also important differences in coverage between the hours series from the household and establishment surveys. The establishment survey provides hours estimates for the total private sector, while the household survey covers all employed individuals. The household survey series includes government workers, private household workers, unincorporated self-employed workers, and unpaid family members—all of which are excluded from the establishment survey hours series.
The productivity series produced by the BLS OPT does not come from a separate survey but is constructed by combining data from three surveys—the CES, the CPS, and the National Compensation Survey (NCS). Productivity measurement requires data on hours worked that cover all private nonfarm workers and have industry definitions that are consistent with those in the output data. Neither the establishment survey data nor the household survey data are ideal. Industry classifications in the establishment survey are more consistent with those used in the surveys that collect output data, but the hours data are hours paid and cover only production and nonsupervisory workers. The household survey collects data on hours worked by all workers but does not use industry classifications that are consistent with those in the output data sources. It is important that industry definitions are consistent for outputs and the inputs used to create them. Otherwise, industry productivity measures will be biased, with the extent of the bias depending on the amount of misclassification and the difference in growth rates.
The primary data source for the OPT productivity series is the establishment survey's production worker hours series (the all-employee hours series is not used because the time series is too short). The data are adjusted from an hours-paid to an hours-worked basis using industry-level ratios of hours worked to hours paid calculated from NCS data. These hours-worked-to-hours-paid ratios capture changes in the amount of annual leave granted and the amount of sick leave taken. This adjustment produces an estimate of production and nonsupervisory worker hours worked. Because of this adjustment, the productivity hours series shows fewer hours worked than the establishment production worker series, even though the productivity series includes nonproduction and supervisory workers while the establishment series does not.
Average weekly hours worked for nonproduction and supervisory workers are estimated using data from the household survey. The household survey data are adjusted to convert them from a per-person basis to a per-job basis, and jobs that are not covered by the establishment survey are dropped from the sample (e.g. government workers, the self-employed, private household workers, and unpaid family members). The ratio of the average weekly hours of nonproduction and supervisory workers to those of production and nonsupervisory workers is calculated and then multiplied by production worker average weekly hours worked to arrive at an estimate of nonproduction and supervisory worker hours. Average weekly hours for all private wage and salary workers are equal to the weighted average of production worker and nonproduction worker hours worked [2]. To fill in remaining gaps, the data on wage and salary workers are supplemented with household survey data on unincorporated self-employed workers, employees of government enterprises (e.g. the Postal Service), and unpaid family members.
Coverage of the productivity hours series differs from the household and establishment survey series because it is driven by the data needed for productivity estimates. The productivity hours series excludes government and nonprofit organizations because outputs for these sectors are derived from inputs (specifically, wages and salaries). Including these sectors would bias estimates of productivity growth downward. Private household workers are excluded because there are no output data for this sector.
Another source of data on work hours is the ATUS, which is a time-diary survey that collects information about how people spend their time and can be used to generate estimates of average weekly hours worked. The BLS does not publish an hours series based on these data, but they are useful for evaluating the accuracy of hours-worked data from the household survey.
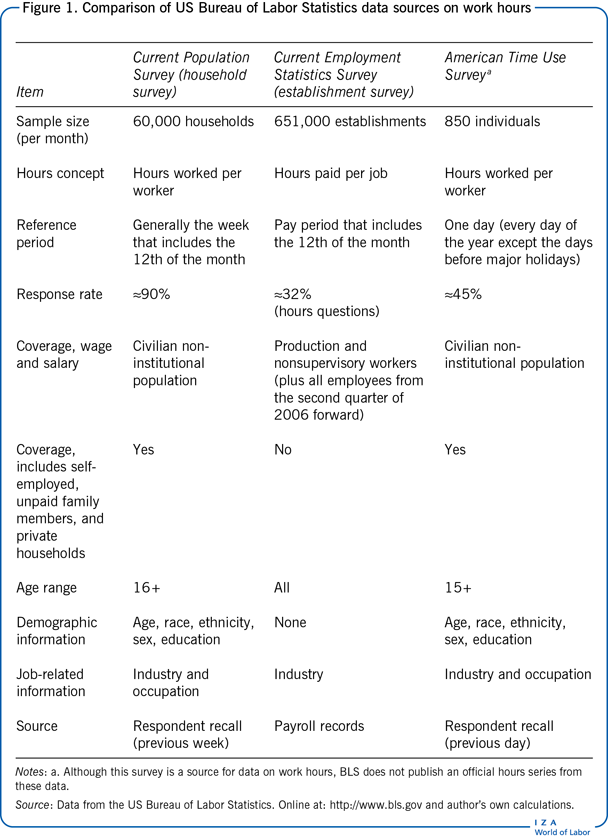
Figure 1 summarizes the key differences among the three BLS surveys that collect information on work hours: the household survey, the establishment survey, and the time-use survey.
Reconciling differences
A natural first step in reconciling differences in work hour estimates between the household and establishment surveys is to examine the accuracy of hours data from the household survey using data from the time-use survey. Research using two methodologies has found that household survey respondents report their total work hours correctly on average, although some demographic groups tend to overestimate hours (e.g. college graduates, full-time workers, and women) while others underestimate hours (e.g. high school graduates and part-time workers) [1], [3], [4], [5].
The research also found that the household survey reference period is not representative of the entire month—workers work longer hours during household survey reference weeks [1]. About one-third of the difference between reference and nonreference weeks was due to the exclusion of holidays from reference weeks. Because the household survey reference weeks are chosen to avoid holidays (to make it easier to interpret month-to-month changes), extrapolating published household series estimates to the entire month overestimates hours worked during the month, even though respondents correctly report their hours for the reference weeks.
Looking at main and second jobs separately, the research found that weekly hours from the household survey are correctly reported on average for the main job but not for second jobs [4], [5]. Specifically, household survey respondents under-report the incidence of second jobs (about 5–6% of workers in the household survey report holding more than one job, compared with about 10–11% in the time-use survey) and over-report hours worked on second jobs (about 14 hours a week compared with about 9 hours). It is likely that the higher incidence of multiple jobholding in the time-use survey is due to self-reporting (compared with mostly proxy reporting in the household survey), which can result in greater reporting of low-hour second jobs. The net effect of this misreporting is that average weekly hours worked on all jobs is overestimated by 0.2–0.4 hours per job per week [4].
Studies making similar comparisons for the UK and Denmark come to similar conclusions about the accuracy of hours reports from household surveys [6], [7]. Hours reports from the UK's household surveys are found to be accurate at an aggregate level, and only minor differences are found between Danish household survey estimates and those from time diaries.
Some of the differences between the household and establishment survey hours series are due to the differences noted in the previous section. For example, research simulating the establishment survey hours data using household survey data (adjusted to establishment survey concepts) found that the difference in levels between the two series is due almost entirely to differences in coverage (all workers in the household survey, production and nonsupervisory workers only in the establishment survey), in the treatment of multiple jobholders (counted once in the household survey, multiple times in the establishment survey), and in the hours concept (hours worked in the household survey, hours paid in the establishment survey) [5].
Other differences were not as easy to reconcile. Although the simulated establishment production and nonsupervisory worker series replicated the actual establishment survey series in levels, it did not replicate the downward trend in the establishment survey hours series [5]. In fact, the simulated establishment survey series was nearly parallel to the original household survey series, but at a lower level of hours worked. There were two periods when the trends in the two series diverged: between 1984 and about 1991 and, to a lesser extent, after 2003 (when measured on a per-job basis). The establishment survey's sample expanded considerably during the 1980s, but there are no data to determine whether the expansion played a part in the decline in the establishment survey series average weekly hours [5].
The effects of other, more subtle, differences between the series were also examined [5]. For example, the greater number of hours worked during the week of the 12th combined with the lengthening of pay periods in the establishment survey between the early 1980s and the mid-2000s could have imparted a slight downward trend because longer pay periods include more low-hour weeks. For the post-1998 divergence, most of the differences in overall hours trends were found to be due to differences in the trends in three industries (retail trade, leisure and hospitality, and professional and business services) rather than to differences in the distribution of workers across industries (composition effects).
International comparisons
Average hours worked per worker are available in National Income and Product Accounts (NIPA), available in the OECD's National Accounts Database and the Conference Board's Total Economy Database [8]. However, the methods used to generate NIPA hours statistics vary greatly from country to country. The OECD cautions that NIPA hours data are not suitable for cross-country comparisons [8].
Labor force surveys (LFS) are more suitable for international comparisons. However, as might be suspected from the research on reference weeks mentioned above, differences in reference weeks must be accounted for. (Internationally, as in the US, reference period effects appear to be related to the presence or absence of holidays.) Moreover, vacation weeks tend to be undercounted in LFS, necessitating supplementing survey data with external data on vacation weeks and public holidays [8].
Cyclical behavior
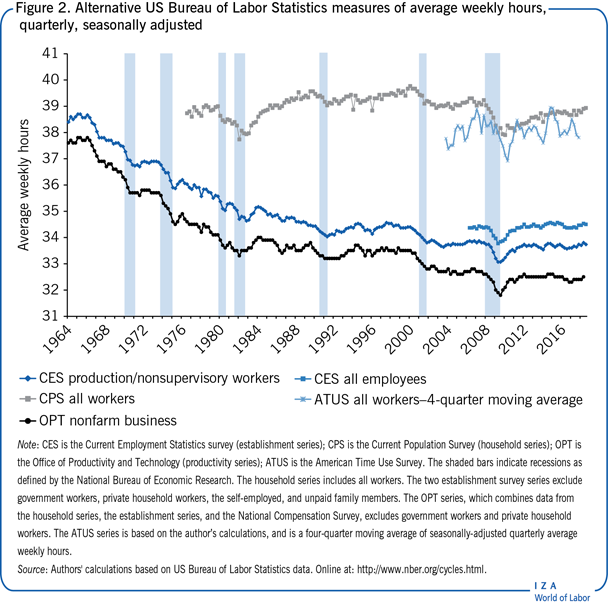
As predicted by theory, all of the BLS hours series exhibit procyclical behavior, although the cyclical patterns are more pronounced in some series than in others (Figure 2). It is easier to see the cyclical pattern in the household series because there is no upward or downward long-term trend. Average weekly hours decline during recessions and rise during expansions. The downward trends of the establishment survey series and the productivity series before 1982 make it more difficult to see how these series vary over the business cycle in those early years. During this period, the rate of decline accelerated during recessions, and the increases after recessions were moderated somewhat by the long-term downward trend. The increases in hours following the last three recessions were much slower than the increase after the 1980–1982 recessions.
A study comparing hours data from the time-use survey with data from the household survey and the establishment survey finds that the time-use survey hours are more cyclical than establishment survey hours but less cyclical than household survey hours [9]. While the study does not directly compare household and establishment survey hours series, it can be inferred that hours from the household survey are more cyclical than hours from the establishment survey.
Other researchers have examined the effect of standard-workweek reporting for salaried workers in the establishment survey on the cyclicality of the establishment survey hours series. The study simulated the establishment survey hours-paid concept for salaried workers using household survey data and compared that series to the household survey hours-worked series [10]. It found that the hours-paid series varies less with the business cycle than the hours-worked series but that the two series tell the same story about long-term changes in average weekly hours.
There is evidence that the relative business cycle volatility of the hours series has changed since 1984—the approximate beginning of the Great Moderation, when GDP exhibited significantly less cyclical volatility [11]. CPS and CES production and nonsupervisory worker weekly hours series became less volatile after 1984, while OPT hours series became slightly more volatile. But after 1984, all three series exhibited more sensitivity to cyclical movements in GDP.
Limitations and gaps
The BLS collects hours data from household and establishment surveys, and each source of data has its advantages and disadvantages.
The BLS's household survey (the CPS) allows for comparisons across demographic groups. But some groups appear to over-report hours in the household survey, while others under-report. Further, the small sample size limits the amount of industry detail, and the industry definitions in the household surveys do not exactly match the definitions in establishment surveys that collect output data, both of which are important for measuring productivity.
The BLS's establishment survey (the CES) collects data on hours paid, which differ from hours worked because of paid leave and off-the-clock work by salaried workers. And, until recently, the establishment survey collected hours data only for production and nonsupervisory workers. However, a major advantage of the establishment survey is its large sample, which allows for more industry detail in published estimates. Moreover, industry definitions in the establishment survey are more consistent with those used in surveys that collect output data.
The ATUS is a newer source of hours data. Because hours reports from time-diary surveys are generally considered to be accurate, it is a useful data source for validating data from the household surveys. But its small sample and infrequent publication (annually) limits its usefulness as a primary source of hours data.
Off-the-clock work and paid leave are concerns when measuring hours worked for productivity statistics, especially when using hours from establishment surveys. The OPT series, which combines establishment and household data as outlined above, offers an example. The NCS data used to convert hours paid to hours worked in the OPT series only accounts for paid leave accrued and sick leave taken—not for off-the-clock work and not for actual leave taken. The OPT methodology for estimating hours for nonproduction and supervisory workers, described above, implicitly assumes that production and nonsupervisory workers are paid for all of the hours that they work. In fact, about 30% of production and nonsupervisory workers are paid a salary, which implies that this assumption does not hold as off-the-clock hours are also an issue for these workers. In addition, because the NCS data only capture changes in leave policies, variation in actual leave taken is not picked up.
One advantage of the household survey over the other sources of hours data is the high response rate—about 90%, with very low item nonresponse for the hours questions. In contrast, the response rate for the hours questions in the establishment survey is only 32%, due mainly to high item nonresponse. The response rate for the all-employee count is about 70%, but only 45% of those respondents provide information about payroll and hours. It is not possible to directly assess the effect of nonresponse on the quality of the establishment survey hours data because no benchmark data are available. The response rate for the time-use survey is higher than that of the establishment survey, but still well below that of the household survey. However, research suggests that nonresponse imparts minimal bias to estimates of hours worked in the time-use survey [12].
Because survey methods and estimation procedures vary from country to country, the results summarized here may not generalize completely to other countries’ hours data. For example, the reference period effect depends on the exact reference period used and how work hours are distributed. However, these studies highlight some of the issues that might arise when collecting data on work hours and illustrate the types of research projects other national statistical agencies might undertake to assess the quality of their data on hours worked.
Summary and policy advice
Given the difficulty of measuring work hours, it is important for decision makers to understand the advantages and limitations of the different hours series.
For comparing work hours across demographic groups, the CPS data are the most appropriate for the US. The household survey can also provide information about hours worked by workers not covered by the establishment survey. The ATUS data also have demographic information, but the small sample size is a limitation, especially for comparing groups over time. And since the BLS does not publish hours estimates from the time-use survey, it is generally necessary to calculate estimates from the microdata. The time-use survey can, however, shed light on the timing of work, both by time of day and across days of the week.
In contrast, the establishment survey and productivity hours series are preferred for comparing hours across industries. Which series is most appropriate depends on the question being asked. The productivity series provides a more comprehensive measure of hours worked by all private nonfarm business sector workers, whereas the establishment survey series measures hours paid to production and nonsupervisory workers. In March 2006, the BLS began publishing hours data for all employees in addition to the production and nonsupervisory hours series.
All the BLS hours series tell qualitatively similar stories about the cyclical behavior of weekly hours, although they differ quantitatively. But the hours series tell different stories about the long-term trend in weekly hours. It has not been possible to explain all of these differences, so one series cannot be recommended over another for comparing long-term trends. Again, which series is most advantageous depends on the question being asked.
Acknowledgments
The authors thank US Bureau of Labor Statistics staff, an anonymous referee, and the IZA World of Labor editors for many helpful suggestions on earlier drafts. Previous work of the authors contains a larger number of background references for the material presented here and has been used intensively in all major parts of this article. The article was produced as part of the authors’ work at the US Bureau of Labor Statistics. The article may be copied freely as long as it is properly cited. The analysis and conclusions expressed in this article are those of the authors and do not necessarily reflect those of the US Bureau of Labor Statistics. Version 2 of the article updates the text to include the BLS's fourth weekly-hours series and adds two new “Key references” [8], [11].
Competing interests
The IZA World of Labor project is committed to the IZA Code of Conduct. The authors declare to have observed the principles outlined in the code.