Elevator pitch
As the third-largest economy in the world and a precursor of global trends in population aging, Japan's recent experiences provide important lessons regarding how demographic shifts affect the labor market and individuals’ economic well-being. On the whole, the labor market showed a remarkable stability during the financial crisis, despite decades of economic stagnation and sluggish real wage growth. Rapid population aging, however, has brought substantial changes to individuals in the labor market, most notably women, by augmenting labor demand in the healthcare services industry.
Key findings
Pros
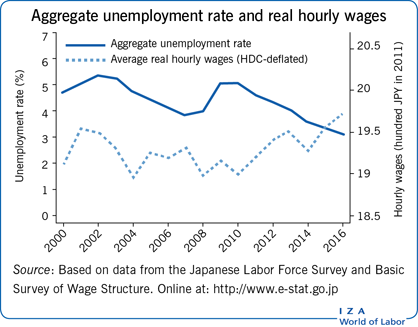
Japan's aggregate unemployment rate has been relatively stable and low.
Women's employment is increasing quickly, while the employment rate among men remains high.
Japan's gender wage gap is shrinking.
Average real wages have been growing recently, most notably among women.
The magnitude of wage inequality in Japan remains relatively small.
Cons
Japan's working-age population has been declining rapidly.
Rising employment among women in Japan coincides with a decline in the marriage rate, which may further accelerate population decline.
Japan's gender wage gap remains substantial.
Wage inequality among men in Japan has increased at the upper end of the wage distribution.
Job stability in Japan has declined as jobs with fixed-term contracts have become more prevalent.
Author's main message
Japan used to be known for having relatively low labor force attachment among women. In the early 2000s, however, the employment rate for women began to surge, reflecting rapid population aging and growing labor demand in the healthcare services industry. Moreover, aggregate labor market outcomes remained steady during the last recession, with a relatively high labor force participation rate and a low unemployment rate. Despite the good news, major difficulties remain in the labor market, including a substantial gender wage gap, declining job stability, rising inequality at the upper end of the wage distribution, and falling real wages among young male workers.
Motivation
Aging populations pose challenges to the fiscal sustainability of many countries as a consequence of shrinking workforces and increasing costs of social insurance programs. Understanding how demographic shifts affect the labor market is crucial for efficiently designing various government programs, including public pensions and healthcare systems. This article documents and examines the recent experiences of a forerunner of global trends in population aging: Japan.
Discussion of pros and cons
Population and the labor force
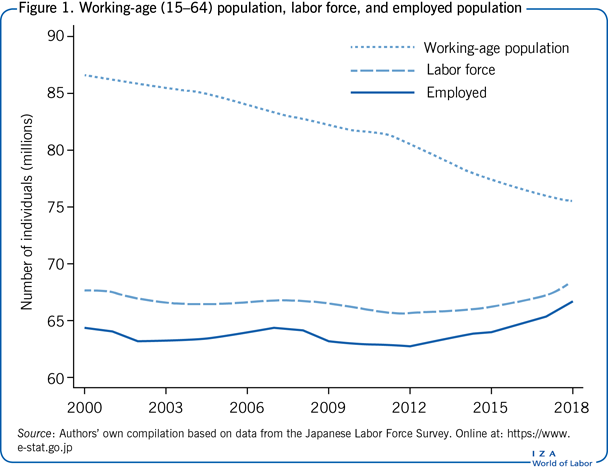
Starting from the mid-1990s, Japan has witnessed a sharp decline in its working-age population (ages 15–64). As Figure 1 shows, the size of the working-age population declined between 2000 and 2018 by slightly more than 11 million, from 86.6 to 75.5 million. The speed of the decline was fastest among OECD countries. Notwithstanding the precipitous fall in the working-age population, the size of the labor force increased during this period by about 0.6 million, from 67.7 to 68.3 million, accompanied by a rise in the employed population from 64.5 to 66.6 million.
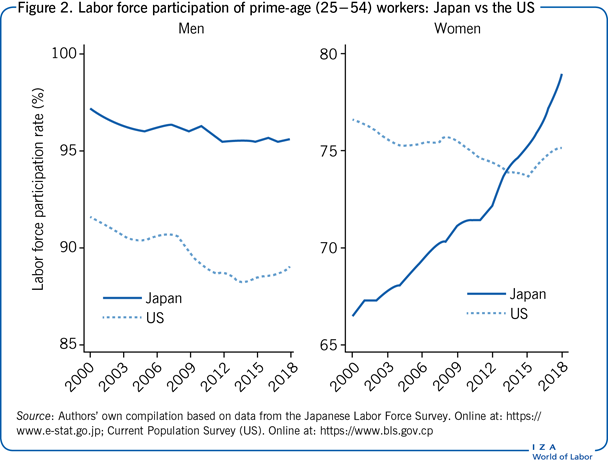
The stability of the labor force reflects the fast-increasing labor force participation rate (LFPR) among prime-age women (ages 25–54). While the LFPR among prime-age women was somewhat stagnant during the 1990s, it rose by about 12 percentage points, from 66.5% to 78.9%, between 2000 and 2018 (Figure 2). Consequently, the LFPR among prime-age Japanese women surpassed that among their US counterparts around 2014. The contrast between the two countries became more conspicuous after the Great Recession, as the LFPR among prime-age adults declined sharply in the US but not in Japan. Together with the relatively stable LFPR among men, the rising LFPR among women played a primary role in sustaining the labor force size in Japan. Indeed, the labor force would have decreased by about 4.3 million between 2000 and 2018 if the LFPR among women had stayed constant at the 2000 level.
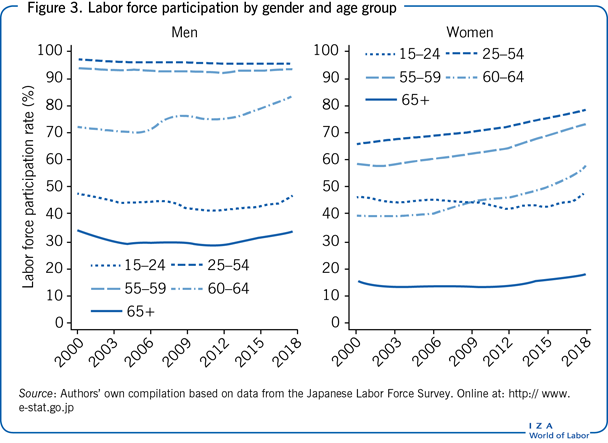
In recent years, the LFPR among older individuals (ages 60–64) has also increased. Starting from 2006, the government legally mandated that employers must offer continuous employment to workers above the age of 60 until they reach their social security pension starting age (65 as of 2019). Interestingly, older workers’ LFPR has increased since around 2006, as Figure 3 documents. Indeed, one study finds that the employment mandate enacted in 2006 has increased employment among men in their early 60s [1]. The LFPR, however, has notably increased not only among older men but also among women since around 2006. The LFPR among individuals aged 65 and above has also risen recently, albeit to a lesser extent.
The share of married individuals in the population of prime-age women declined from 75.0% to 66.7% between 2000 and 2018. At the same time, the LFPR among married prime-age women increased rapidly from 59.4% to 73.7%, whereas the LFPR among single prime-age women stayed at a high level of around 87–89%. Delayed marriage does not, therefore, account for the progress of prime-age women in the labor market by itself. So, why has the LFPR among married women increased recently? There could be multiple reasons, including rising wages among women, declining fertility, falling earnings among male spouses, and reforms of family policies as supply-side factors, as well as demand shifts favoring female workers induced by transitions in the industrial structure, with declining manufacturing and expanding service sectors.
Employment growth
The surging LFPR among women coincides with rapid employment growth among them. Between 2002 and 2018, the number of employed women increased by about 3.5 million (13.6%), while men's employment declined by about 0.2 million (0.5%), as Figure 4 demonstrates. Employment growth for both genders is concentrated in the service industries, most strikingly in the healthcare services industry. Women's employment in healthcare services increased sharply, by about 2.7 million between 2002 and 2018. Consequently, about 21.3% of female workers were employed in the healthcare services industry in 2018. Men's employment in healthcare services increased by about 0.9 million, partially offsetting their quickly falling employment in the construction and manufacturing industries.
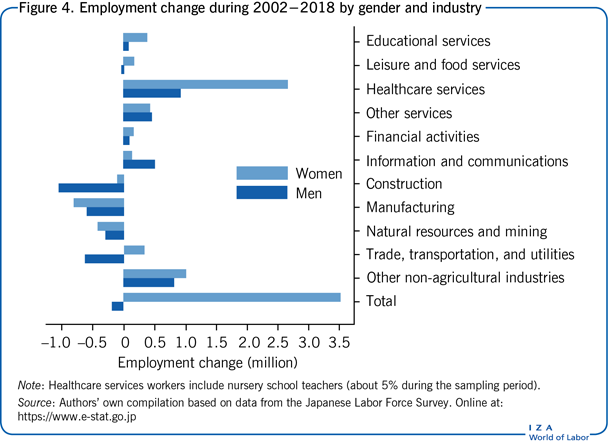
The fast-growing elderly population appears to be a main driver of the rising employment in the healthcare services industry. To cope with the increasing demand for healthcare services, the government recently implemented several policy reforms in the universal health insurance system. One example is the introduction of the “long-term care insurance” system in 2000 that provides affordable, home-based nursing care services to the elderly in need. Since the policy reform, the use of home-based care services has increased rapidly, thus raising labor demand for care workers.
Japan's recent experiences suggest that population aging may have profound influences not only on labor supply but also on labor demand. Traditionally, healthcare sectors in Japan, similar to those of many other countries, tend to employ more women than men. As long as this trend continues, population aging may contribute to narrowing the gender employment gap even further.
Unemployment
The aggregate unemployment rate in Japan rose steadily over a decade of economic stagnation during the 1990s. The unemployment rate reached 4.7% at the outset of the new century, slightly higher than the US rate. While the unemployment rates of the two countries evolved similarly during the early 2000s, a striking divergence emerged afterwards. In particular, while the US economy underwent soaring unemployment during the Great Recession, Japan's aggregate unemployment rate did not exhibit radical upheavals, never exceeding the previous peak level.
The stability of the aggregate unemployment rate is not a mere artifact of the relative scarcity of young workers, among whom unemployment rates tend to be higher than the average. As Figure 5 indicates, the unemployment rate among youth (ages 15–24) did not skyrocket in Japan during the Great Recession, unlike in other OECD countries. In 2009, the youth unemployment rate reached 10.3% for men and 8.2% for women, which was far lower than the US average youth unemployment rate of 17.6%. Japan's youth unemployment rate declined steadily from 2010; it reached 4.1% for men and 3.5% for women in 2018, ranking, on average, the lowest among OECD countries [2].
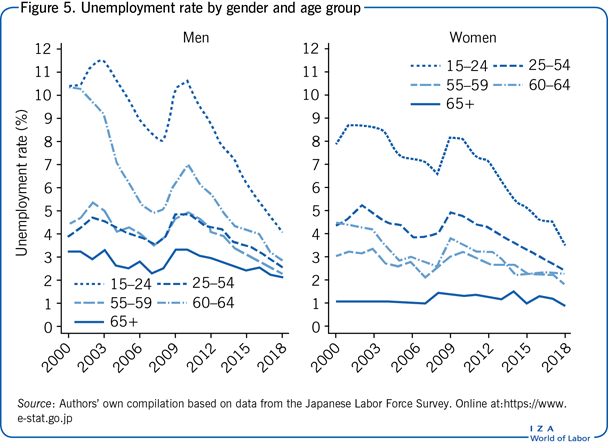
In recent years, unemployment rates among older workers (ages 60–64) have also declined notably. In 2000, older male workers’ unemployment rate was 10.4%, much higher than the average. The relatively high unemployment rate might reflect the fact that most workers were required to leave their workplace at age 60 due to mandatory retirement contracts. Nonetheless, older male workers’ unemployment rate has declined substantially since around 2001, reaching 2.9% in 2018. Little is known, however, about what caused such a dramatic fall of the unemployment rate among older male workers. One possible cause might be the pension reform that started from 2001 and gradually raised the starting age of the social security pension from 60 to 65. This pension reform may have reduced the value of retirement options for older workers, increased their job search efforts, and provided firms with stronger incentives to create jobs for them.
Trends in hourly wages
Figure 6 shows the trajectories of nominal and real wages for men and women, respectively. All the wage data are taken from the Basic Survey of Wage Structure (BSWS), which provides a nationally representative sample of wage employees in Japan. Hourly wages are calculated as average monthly labor earnings divided by average monthly hours worked, which may differ from actual hourly wages. Note that this hourly wage measure can be viewed as a weighted average of actual hourly wages, with higher weights given to workers with longer monthly hours worked. To deflate nominal wages, the consumer price index (CPI) was used, as well as the household domestic final-goods consumption (HDC) deflator. The latter is similar to the personal consumption expenditure (PCE) index used in the US.
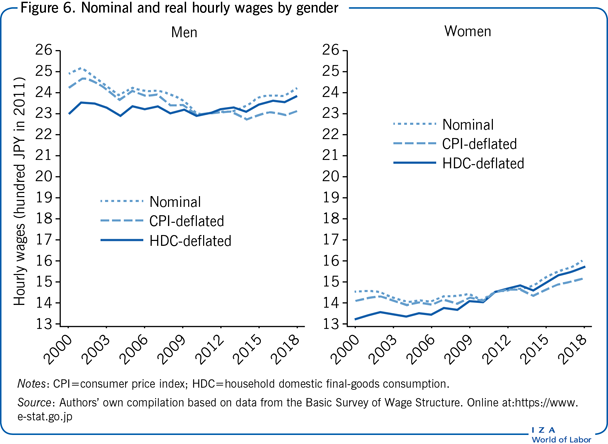
Men's nominal wages declined notably between 2000 and 2010 by about 8.2%, followed by a moderate recovery between 2010 and 2018, with a temporary stagnation around 2015. The disparities between the two price indices are so large that the two series of real wages for men differ markedly. In particular, between 2000 and 2018, the CPI-deflated real wages declined by about 4.9%, while the HDC-deflated real wages increased by about 4.0%. Despite the clear disparity between the two price series, little research has been carried out to account for the divergence. Nonetheless, that nominal wages fell while real wages increased, a remarkable phenomenon in wealthy economies, likely reflects the long-term deflation in Japan that occurred during this period. In contrast, women's nominal wages clearly began to rise starting around 2004. Between 2004 and 2018, nominal wages increased by about 12.8%, while the (HDC-deflated) real wages increased by about 15.9%. As a result, the gender wage gap has been shrinking in recent years.
The sluggish wage growth, despite the tight labor market with a remarkably low unemployment rate, attracted attention both from researchers and policymakers. Compositional changes among workers may be a plausible reason for this apparent puzzle. As the labor demand curve shifts outward, new workers are added to the labor market along the labor supply curve, which may bring about non-trivial compositional changes among workers. In particular, an increase of low-skilled workers may suppress average wages among workers.
To address such compositional changes, the Japan Panel Study of Employment Dynamics (JPSED) has been used which is conducted by the Recruit Works Institute through internet surveys. The survey started in 2016 with a sample of 49,131 individuals and added supplementary samples in the following years. Hourly wages have been constructed based on annual earnings and annual hours worked for workers not paid per hour, dropping the bottom and top 5% of hourly wages to mitigate the possible influence of measurement error. This sample construction results in 33,335 individuals observed in either 2016 or 2017.
Among the 33,335 individuals, hourly wages are observed in either 2016 or 2017 for 66–67%, whereas they are observed in both years for only 60%, suggesting the need to pay attention to compositional changes. Compared to the whole sample, the subsample of individuals with consecutive wage observations has not only higher hourly wages, on average, but also higher growth rates of average hourly wages. Such patterns may arise when skilled individuals have a stronger labor market attachment. The higher rate of wage growth among continuously employed workers suggests that compositional changes in the workforce, in part, account for the reasons why sluggish wage growth is observed, on aggregate.
As an additional exercise, average growth rates of hourly wages are calculated, which may differ from the growth rates of average hourly wages. The average growth rate of hourly wages is 6.0%—far above the 2.4% growth rate of average hourly wages. This discrepancy can be attributed to higher wage growth rates among low-skilled workers, as their wages do not contribute much to raising average wages.
Substantial variations in aggregate wages exist across age groups. The left panel of Figure 7 shows that real wages among male workers aged 35–44 declined noticeably starting from around 2005, while those for other age groups increased somewhat slowly. This decline implies that the age–wage profiles of recent cohorts flattened after the mid-2000s. Women aged 45–59 used to earn lower wages than younger women (ages 25–44). This wage gap may reflect wage penalties that arise from career interruptions related to childbearing. The real wages of women aged 45–59, however, caught up with those of younger women between 2000 and 2018, possibly due, in part, to the declining marriage rate within the group.
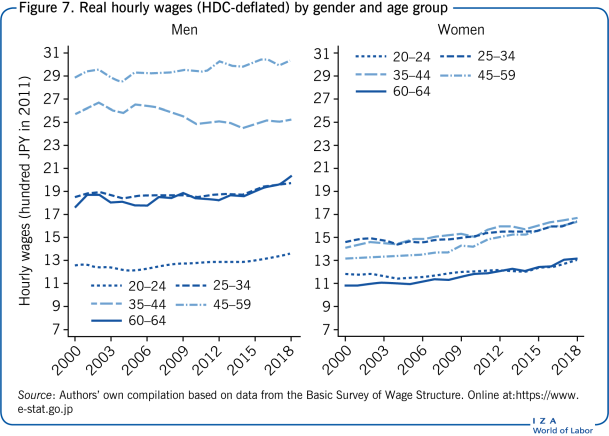
The gender wage gap remains substantial. This reflects the prevalence among women to have jobs with fixed-term contracts, which often pay relatively low wages. In 2018, about 49.3% of female workers worked under a fixed-term contract, compared to only 18.0% of male workers.
Wage distribution
Figure 8 presents HDC-deflated percentiles (10th, 50th, and 90th percentiles) of monthly wages among full-time workers for men and women, respectively. Wage inequality has been rising steadily at the upper end of the distribution, notably among men. Specifically, between 2001 and 2018, the 90–50 ratio (the wage at the 90th percentile divided by the median wage) for men increased from 1.73 to 1.80, while that for women stayed around 1.59. The authors of one study argue that rising inequality since 2000 can be largely accounted for by an increasing share of relatively more educated and experienced workers, among whom wages are more dispersed [3]. During this period, the 50–10 ratios (the median wage divided by the wage at the 10th percentile) were relatively stable, with a small decline for men from 1.60 to 1.57 and a modest increase for women from 1.44 to 1.45. Compared to the US, both the 90–50 ratio and the 50–10 ratio are lower, indicating that Japan's wage distributions are relatively more concentrated around the median. Contrasts between the two countries can be partly accounted for by the relatively rapidly growing supply of college-educated workers in Japan, which has reduced the wage gap between college graduates and high school graduates [4], [5].
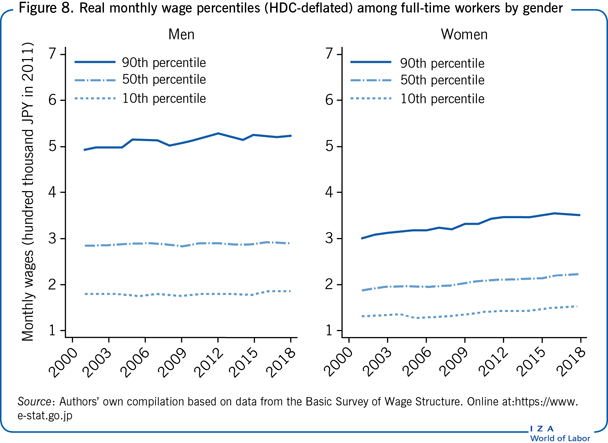
Even though men's wage growth was sluggish at both the median and the lower end of the wage distribution, real monthly wages among full-time working women steadily increased between 2001 and 2018 throughout the wage distribution. In particular, the growth rates of real monthly wages for full-time working women during this time period were similar, around 17%, at the three percentiles of the wage distribution.
Limitations and gaps
While some plausible causes that may account for changes in the Japanese labor market during 2000–2018 have been pointed out, many of the arguments remain speculative. Further research is clearly needed to understand the driving forces of these important changes. In particular, further research is warranted to understand better why women's LFPR has increased together with that of older men. An interesting research agenda would be to investigate the relative importance of potential reasons why the LFPR has risen so quickly among prime-age women in recent years.
The fast-rising LFPR for women and older men likely altered skill compositions among workers, which may generate non-trivial sample selection problems for identifying changes in the wage structure. Analyses of wages are entirely descriptive and thus subject to this caveat. That being said, it would be interesting to see how rising wages among women are driven by changes in skill compositions, as well as by variations in skill pricing.
Summary and policy advice
Japan's recent labor market experiences exemplify how rapid population aging affects the structure of the labor market through an expanding healthcare services industry. As a consequence, female labor force participation is increasing and more than one in five female workers is currently employed in the healthcare services industry.
In the face of the growing demand for childcare services due to rising employment among women, securing an adequate supply of healthcare workers and childcare professionals is a key policy issue. Given that the markets for healthcare and childcare services are publicly run or heavily regulated, comprehensive policy designs that address the pricing of such services and the training of childcare workers are necessary. Carefully designed interventions in those industries may facilitate an efficient division of labor based on the comparative advantages of workers with heterogeneous skills and may generate efficiency gains from the scale economies in providing services. Policymakers should therefore design healthcare and childcare programs in light of their potentially positive welfare effects.
Acknowledgments
The authors thank the IZA World of Labor editors for many helpful suggestions on earlier drafts. This work was supported by JSPS KAKENHI grants 15H05692, 16H06322, 16H03630, 16K21743, and 17K13747. Version 2 of the article updates the content and figures to 2018.
Competing interests
The IZA World of Labor project is committed to the IZA Code of Conduct. The authors declare to have observed the principles outlined in the code.
© Daiji Kawaguchi and Hiroaki Mori