Elevator pitch
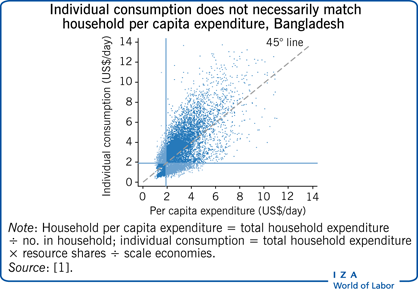
A key element of anti-poverty policy is the accurate identification of poor individuals. However, measuring poverty at the individual level is difficult since consumption data are typically collected at the household level. Per capita measures based on household-level data ignore both inequality within the household and economies of scale in consumption. The collective household model offers an alternative and promising framework to estimate poverty at the individual level while accounting for both inequality within the household and economies of scale in consumption.
Key findings
Pros
Accounting for intra-household inequality and economies of scale is critical to measuring individual-level poverty.
Poor individuals may live in non-poor households; so, poverty measures based on per capita household consumption or equivalence scales may misclassify poor individuals.
The collective household model provides a framework to estimate individual-level poverty from household-level data.
Evidence suggests that poverty measures estimated using the collective model can improve upon per capita poverty measures.
Cons
The data requirements to estimate poverty at the individual level may be burdensome.
The collective model per se does not account for differences in needs across household members (e.g. children versus adults).
Identification results assume separability between consumption and other critical aspects of household behavior (e.g. labor supply, savings, and home production); this is usually not the case.
Individual welfare is multidimensional; both per capita poverty measures and those estimated using the collective model focus only on consumption.
Author's main message
Poverty is an individual-level concept but typically measured using household-level data. Standard household per capita consumption measures do not account for inequality within the household or economies of scale in consumption, which may be important. Collecting individual-level consumption data on a large scale is challenging and costly. The collective household model provides a promising framework to measure poverty at the individual level that only requires data on one private assignable good. Results suggest that standard poverty measures may dramatically understate the poverty status of certain individuals (e.g. women and children), and that many poor individuals reside in non-poor households.
Motivation
Poverty measures should be consistent in the space of welfare: if two individuals have the same welfare, they should have the same poverty status [2]. But welfare is unobservable, and poverty measures must rely on proxies, with the most common one being consumption. In this article, the use of consumption expenditures to measure individual poverty and related practical issues are examined. Welfare is discussed as it applies to standard utility maximization theory; however, welfare can also be derived from other non-material sources that may not be correlated with consumption. An overview of the issue is provided in [2].
Identifying poor individuals using consumption is challenging because consumption data are almost always collected at the household level. So, poverty rates are typically calculated based on per capita expenditure, that is, total household expenditure divided by the number of individuals that habitually reside in the household. If this measure is below the poverty line, then everyone in the household is poor; if not, then no one in the household is poor. It follows that per capita poverty measures implicitly assume that there is equal sharing of resources within the household. These measures also ignore economies of scale in consumption and assume that individuals derive the same amount of welfare from the same value of consumption, regardless, for example, of their age or gender. This begs the questions: how important are (i) intra-household inequality in consumption, (ii) household size, and (iii) the household's demographic composition for poverty measurement? And, if they do matter for accurate poverty measurement, how can they be accounted for?
Discussion of pros and cons
Standard approaches to poverty measurement
Income poverty measurement can be thought of through the lens of a consumer choice problem, where a so-called “utility threshold” that separates the poor from the non-poor is determined first, and then the consumption necessary to reach this threshold is set as the poverty line. There are two challenges to this approach: the first involves translating welfare into something that can be reliably measured, and the second requires determining where to set the utility threshold and hence the poverty line.
Income or consumption are typically used as proxies for welfare: the higher the income or consumption, the higher the welfare. For poverty measurement in a developing country setting, consumption expenditure is often preferred, as income fluctuates frequently, particularly in agricultural areas, and can be difficult to measure properly. Consumption, however, has its own measurement issues, particularly when it comes to measuring prices, but is considered a better indicator than income for standards of living and well-being [2]. Nevertheless, the problem remains as to whether the way to translate consumption expenditures into welfare is the same for each person. Specifically, if basic needs vary with demographic characteristics, such as age, gender, occupation, or geographic location, then a one unit increase in consumption expenditure will yield different increases in welfare for different individuals. In other words, some individuals may require fewer resources than others to reach the utility threshold.
Determining the utility threshold (which is often referred to as the “referencing problem” [2]) is similarly challenging. Poverty is a subjective concept, depending highly on context and culture. Individuals within and across countries are unlikely to agree on what constitutes a poor household and poverty lines can vary considerably across countries. One possible solution to this issue could be to ask people about their subjective welfare and use this information to infer a subjective poverty line. For example, the often-used minimum income question (MIQ) asks: “What income level do you personally consider to be absolutely minimal? That is to say that with less you could not make ends meet.” While poverty lines set using subjective welfare-type questions may be appealing, they also have a number of limitations, a key one being that there are almost certainly latent factors influencing how people answer such questions that cannot be accounted for (such as personality or social norms).
An alternative, perhaps more objective, approach is to fix a basket of goods that an individual might need in order to meet some specified level of welfare (below which they are considered poor). Often, this basket will include food needed to support recommended dietary intakes and may be augmented with an allowance for non-food goods (essentially anchoring the utility threshold to biological needs). The value of this basket pins down the poverty line. One problem here lies with determining what should be included in the basket, and how large the non-food allowance should be.
Any poverty measure, either objective or subjective, still faces the same issue: whether or not it is consistent in the space of welfare. Household-level measures exacerbate this challenge: not only do households differ substantially in demographic composition and size, they may also not allocate household resources equally within the household. It may be possible that some household members have a substantially lower welfare relative to others. By using the standard per capita approach, which assigns every household member the same value of consumption, and comparing every individual to the same poverty line, it is unclear whether welfare-consistent comparisons can actually be carried out. Furthermore, household-level measures do not allow for variation in poverty status within the household: so, if one member is poor, then all other members must be poor. As shown later on, this may not hold true in many circumstances.
Equivalence scales
Different household members, along with different household types (e.g. with different demographic compositions or different sizes), are likely to require different levels of consumption. On the one hand, due to economies of scale in consumption, larger households may need fewer per capita resources than smaller households to attain the same level of welfare. For example, more people jointly consume goods that can be shared, such as energy goods. On the other hand, household members may differ in their needs. Children and the elderly, for example, may require less food than working-age adults to maintain a healthy diet, and individuals working in high-activity jobs may need more calories than those who do not. In households where food is a substantial portion of the budget or with higher than average dependency ratios, these differences are likely to have a non-trivial effect on poverty measurement.
Equivalence scales can be used to rescale total household consumption to address these issues. To account for both economies of scale and differences in needs in poverty measurement, it is possible to calculate “equivalent consumption” as household expenditure multiplied by a specific factor, the inverse/reciprocal of the equivalence scale. This equivalence scale depends on the sum of the number of adults in the household (nₐ ) plus the number of children (nₖ ) whereas the number of children is multiplied by a factor beta (as children's needs are set to be a fraction of adults’ needs the scaling factor beta is set between 0 and 1). To get to the equivalence scale this sum is raised to the power of a factor alpha that captures economies of scale in consumption (again, alpha must be greater than 0 but no greater than 1), that is, the equivalence scale equals (nₐ–βnk )ᵃˡᵖʰᵃ.
This whole calculation can be adapted to include different person types, such as the number of elderly members or working-age male and female adults, and yields the per capita household expenditure (with alpha and beta set to 1). For a four-person household with two adults and two children, with beta=0.5 and alpha=1 (i.e. no economies of scale), the equivalent consumption would be just one-third of household expenditure, hence significantly higher than per capita expenditure. The presence of scale economies (e.g. alpha=0.6) would result in even higher equivalent consumption (roughly one-half of household expenditure).
The challenge is in setting accurate values for alpha and beta, which requires knowledge of the needs of different individuals as well as the extent of consumption sharing within the household. An additional complication is that alpha and beta are usually related: for instance, larger households tend to have more children relative to adults, as children cannot live alone but adults can. In practice, alpha and beta are often chosen based on ad hoc assumptions. A common example of equivalence scales is the OECD scale (or Oxford scale), which equals 1 for the first adult household member, plus 0.7 for each additional adult, plus 0.5 for each child. So, a typical family of four, with two parents and two children, would be assigned an equivalence scale of 2.7. The so-called square-root economies of scale parameter, which sets alpha=0.5, is also common. An alternative three-parameter equivalence scale is used in the US and is given by (1+0.8+0.5(nₖ –1))˄0.7 for single-parent households, and by for (nₐ +0.5nₖ )˄0.7 households with multiple adults.
The question is: How much do changes in the values of alpha and beta affect poverty measurement? A recent study addresses this question in the context of poverty comparisons between male- and female-headed households (MHHs and FHHs, respectively) in sub-Saharan Africa [3]. The authors find that, based on per capita expenditure, FHHs have lower poverty rates than MHHs. However, even small adjustments for scale economies can change these comparisons: the value of α at which FHHs would have higher poverty rates than MHHs ranges from 0.95 in East Africa to 0.15 in West Africa. Such sensitivity reflects the fact that FHHs are substantially smaller than MHHs, on average. By contrast, variations in adult equivalence scales matter less in this setting, as dependency ratios are relatively similar in FHHs and MHHs.
Intra-household inequality in resource allocation and poverty measurement
Equivalence scales can be useful to capture differences in needs across individuals as long as these differences are stable within person types: for example, if all children need less than working-age adults and by the same amount. However, the usefulness of equivalence scales breaks down when differences in needs are diverse within person types, or if there is discrimination against certain individuals within the household. Importantly, equivalence scales assign the same value of consumption to each household member. As a result, they cannot account for circumstances in which some household members have welfare values below the threshold while others do not. In other words, they cannot account for intra-household inequality and for the fact that poor and non-poor individuals may reside in the same household.
How critical is intra-household inequality? As previously mentioned, assessing the scope of intra-household inequality in consumption is complicated by the fact that consumption data are typically collected at the household level. A handful of surveys have exceptionally collected data on individualized consumption, and intra-household inequality has been found to be far from negligible using these data. For example, examining Bangladesh, an upcoming study finds that adults have substantially higher levels of food and clothing consumption relative to children, and women have slightly lower consumption levels relative to men [4]. Focusing on food consumption in Bangladesh, another recent study finds that intra-household inequality accounts for almost 50% of total inequality in caloric intakes, which is only partially accounted for by differences in caloric requirements by age, gender, and type of occupation [5].
Given the scarcity of individualized consumption data, researchers have relied on differences in nutrition-based anthropometric indicators (i.e. whether an adult is underweight or a child is stunted or wasted) to measure the extent of intra-household inequality. For example, a 2019 study finds that around three-quarters of undernourished women and children in sub-Saharan Africa are not found in the poorest 20% of households [6]. In other words, undernourished individuals are more likely to be found in households that are not poor rather than poor. Furthermore, it is not the case that all household members share similar nutritional outcomes: the majority of undernourished women and children are found in households where the male head is not underweight.
The collective household model
Model overview and identification
In the collective household model, a household consists of different types of individuals, such as prime-aged men and women, children, and the elderly. Each individual has different preferences over goods, and may differ in their decision-making power within the household. The key assumption of the collective model is that the allocation of goods across individuals within the household is Pareto efficient. That is, no individual can be made better off without making another household member worse off.
It follows from so-called duality theory and decentralization welfare theorems that the household program can be decomposed in two steps: (i) the allocation of the household consumption expenditure across family members and (ii) the individuals’ maximization of their own utility subject to their own budget constraint. “Resource shares,” that is, the share of household consumption expenditure allocated to each individual, provide an explicit measure of both the existence and extent of consumption inequality within the household. In this setting, a measure of individual-level consumption can be obtained by multiplying resource shares and total household expenditure.
The model also allows for goods to be public, private, or partially shared, within a single household. So, individual-level expenditures can be inflated by a scaling factor that accounts for economies of scale in consumption. The degree to which individual-level expenditure is inflated may be increasing in household size, as there are more opportunities for joint consumption in larger households. Unfortunately, neither resource shares nor economies of scale in consumption are observable in most household surveys, nor are they identified without additional assumptions.
A study from 2013 identifies resource shares and the extent of joint consumption by assuming preference stability across single individuals and individuals in married couples [7]. Since data are available only at the household level, the idea is that the observed behavior of singles can be used to infer certain aspects of the unobserved behavior of couples. Subsequent research has achieved identification of resource shares (but not economies of scale in consumption) by comparing demand functions of “private assignable” goods (i.e. goods that are not shared at all, and the researcher observes which household member consumes them; clothing is one example of such a good) [8]. Importantly, this identification method does not infer relative total consumption from the relative consumption of a single good. Rather, it recovers what each individual's share of total expenditure is by placing restrictions on how preferences over an assignable good vary across either household members or household types.
Empirical applications
Given its ability to shed light on within-household consumption, several recent studies have applied the collective household model to measure individual-level poverty.
The authors of one such study, which focuses on measuring child poverty in Malawi, estimate resource shares separately for men, women, and children, and document extensive inequality within the household [8]. They find, for instance, that in a nuclear household with two children, the father, mother, and each child are allocated 42%, 22%, and 18% of the total household expenditure, respectively. The wide scope of intra-household inequality in Malawi results in per capita measures dramatically understating poverty rates for children. A study from 2021 extends this approach to a setting with only partially assignable goods to estimate intra-household allocations between foster and non-foster children in Malawi, finding little evidence of inequality between them [9]. Another recent study examines resource allocation in Indian households and shows that women's resource shares relative to men's decline steadily after the age of 45, when on average women get as low as 65% of men's resources [10]. As a result, at post-reproductive ages, poverty rates are significantly higher for women than men, which can help explain the disproportionately high mortality rates of older women in India.
A caveat to these works is that they do not estimate economies of scale in consumption. In other words, they provide estimates of individual-level “expenditure” rather than individual-level “consumption.” This distinction is not necessarily problematic, as households in both contexts primarily consume private goods such as food. Nonetheless, to accurately measure individual consumption, it would be necessary to account for both intra-household inequality and joint consumption.
This is what motivates recent work on the topic, which successfully identifies both dimensions of consumption [1]. The authors’ method relies solely on observing expenditures on a single private assignable good and, unlike much of the existing literature, does not require data on single-person households. As a result, their approach is ideal for applications in developing country settings, where individuals rarely live alone. Their empirical analysis focuses on Bangladesh and Mexico, with the goal of illustrating differences in consumption sharing across countries at different stages of economic development. In Bangladesh, they find a modest amount of consumption sharing, suggesting that ignoring economies of scale is not likely to lead to a large degree of error in individual consumption estimates. By contrast, they estimate significant economies of scale in consumption in Mexico, which, for example, increase individual consumption in extended families or nuclear families with multiple children by 10% relative to nuclear families with one child.
Comparing standard and model-based poverty rates
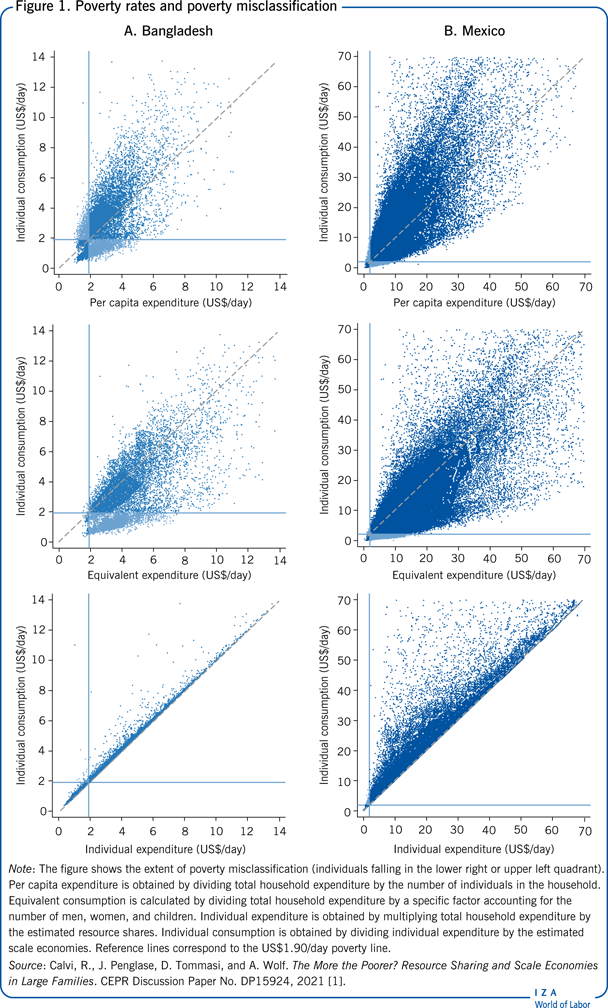
The above-mentioned study also compares poverty rates for Bangladesh and Mexico obtained using different consumption measures [1]. Specifically, the authors juxtapose poverty rates based on per capita expenditure, equivalent consumption, individual expenditure, and individual consumption. Figure 1 summarizes their findings. Each sub-figure features the estimates of individual consumption on the y-axis and alternative measures on the x-axis. Each dot in the scatter plot is an individual and the vertical and horizontal lines lines correspond to the US$1.90/day poverty line. For individuals falling in the upper right or lower left quadrants, the two poverty measures coincide. That is, individuals who are classified as poor using individual consumption are also classified as poor when using the alternative measure. On the other hand, individuals falling in the lower right quadrant would be considered poor using individual consumption, but not the alternative measure. As shown in the figure, there is a large degree of poverty misclassification, especially when using per capita expenditure and equivalent consumption. While the degree of poverty misclassification may vary substantially across contexts, these results show that accounting for intra-household inequality and economies of scale in consumption may matter greatly for poverty measurement. The collective household model can be used to compute poverty rates that encompass both dimensions.
Limitations and gaps
While the collective household model can help address some of the weaknesses of existing methods for poverty measurement, much more work and development are required before these results can be viewed as clear improvements to current practice. First, none of the approaches discussed in this article (including the collective household model) can pin down what the utility threshold really is, nor are they able to address the amount of resources each individual needs to attain it. To address this issue, the poverty lines for children could be set to a fraction of adults’ [8] or be rescaled based on caloric requirements by age and gender [5]. Both approaches, however, are admittedly ad hoc, and could be improved on. Second, the model outlined earlier is a model of household consumption behavior and ignores decisions about savings, labor supply, and home production by implicitly assuming separability (that is, consumption and non-consumption decisions are made independently). Future work should try to incorporate these components into the model. Third, much of the existing work is limited to nuclear households (two parents and their children), but future research should focus on family structures that are common in developing countries (e.g. extended households, which include near relatives, such as grandparents, aunts, or uncles, in addition to a nuclear household) [1]. Fourth, future work should focus on improving researchers’ understanding of why existing identification approaches may fail (as in [11]), and relaxing some of the modeling assumptions (as discussed in [12]). Fifth, the empirical implementation of the collective household model typically requires the estimation of highly nonlinear models, which has proven to be computationally difficult. Frameworks delivering simpler estimation models would be beneficial [13].
Summary and policy advice
Measuring poverty at the individual level is a critical task of anti-poverty policy. Relying on household-level targeting strategies for anti-poverty policy may mean that poor individuals in non-poor households will not be reached. This underreporting of poor individuals in non-poor households may undermine highly needed policy.
The collective household model provides a coherent framework to make advancements in measuring poverty more effectively, with relatively few data requirements. Work by policymakers is underway to incorporate it into standard policy analysis [13]. Nevertheless, more information on individual-level welfare is needed. Furthermore, the collection of richer and more detailed data is also essential to improve the identification and estimation of the collective household model and provide ways to validate its use for poverty measurement.
As a final note, policymakers are encouraged to take within-family allocation (and its implication for poverty reduction) seriously. In instances where intra-household inequality is expected to be substantial, different targeting approaches may be more effective in reaching the poor. In-kind transfers (such as school meals for children) may be a valid alternative.
Acknowledgments
The authors thank an anonymous referee and the IZA World of Labor editors for many helpful suggestions on earlier drafts. The authors would also like to highlight work by Olivier Bargain, Martin Browning, Pierre-Andre Chiappori, Laurens Cherchye, Angus Deaton, Bram De Rock, Olivier Donni, Geoffrey Dunbar, Sylvie Lambert, Valerie Lechene, Arthur Lewbel, Krishna Pendakur, Martin Ravallion, Dominique van de Walle, Frederic Vermeulen, and their coauthors, who have been instrumental in this literature.
Competing interests
The IZA World of Labor project is committed to the IZA Code of Conduct. The authors declare to have observed the principles outlined in the code.
© C. Brown, R. Calvi, J. Penglase, and D. Tommasi