Elevator pitch
Efficiency is an important consideration for those who manage public services. Costs vary with output and with a variety of other factors. In the case of higher education, for example, factors include quality, student demographics, the scale and scope of the higher education provider, and the size and character of the real estate. But even when taking all these factors into account, costs vary across providers because of differences in efficiency. Such differences offer clues about good practice that can lead to improvements in the system as a whole. The role of efficiency is illustrated by reference to higher education institutions in England.
Key findings
Pros
Examining the costs of public services provides a valuable evidence base to inform case studies aimed at more in-depth analyses of efficiency.
Differences in measured efficiency vary—but the differences may be instructive to policy making.
The recommended statistical approach (frontier analysis with latent classes) relates efficiency directly to what is known about the costs of public service provision and the factors affecting costs.
The approach accommodates concepts of scale and scope, which are important for the consideration of concentration of resources and merger activity.
Cons
The latent class approach does not allow a fine level of disaggregation, with highly correlated variables or limited degrees of freedom.
The latent class approach does not necessarily result in an intuitively appealing classification of institutions.
Estimated efficiency is based on asymmetries in the statistical error, so the confidence intervals around central estimates may be wide.
The concept of efficiency relies on subjective decisions about what cost differences might be permissible, but application of a statistical approach might firm up these judgment calls.
Author's main message
Policymakers need information that can be used to evaluate efficiency in public services. Despite some value judgments in the definition of efficiency, data can offer helpful clues about the relative efficiency of service providers. Statistical methods that allow for the possibility that providers differ in ways that are not immediately obvious (because available data are limited) can reveal differences in measured efficiency. The tools used to evaluate the efficiency of public sector service providers offer an important check on how well taxpayers’ money is being spent and can be widely applied by governments.
Motivation
One of the key roles of government is to provide public goods and services. In a competitive industry, providers face pressure to convert inputs into outputs as cheaply as possible (at a given level of quality). This pressure encourages them to be efficient. Where the usual disciplines of a competitive market are absent, as in the provision of public services, it is important to evaluate efficiency. Transparency about efficiency can inform the electorate, who may wish to support political parties that have a good track record in this regard. Moreover, identifying efficient providers can enhance efficiency by allowing the recognition and spread of good practice.
An example that can illustrate how to evaluate efficiency in public service provision is higher education in England, which is financed by a mix of public and private funds, including tuition fees, and is heavily regulated. In some respects, competition between providers is intense. In others, the effects of competition are blunted by a complex set of institutions. Taken as a whole, it would not be justifiable to assume that providers in the sector are efficient. Rather, because the extent to which higher education providers are efficient is an empirical issue, it is important to measure it.
The research reported here is based largely on work undertaken for the UK Department for Business Innovation and Skills [1]. It relies heavily on several earlier methodological developments [2], [3], [4], [5].
Discussion of pros and cons
Refining the conventional model
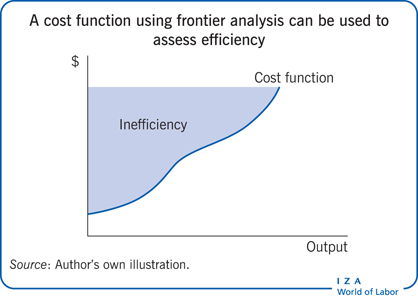
The basic approach taken in the analysis is the statistical estimation of models designed to explain the costs of higher education institutions. The approach differs from a conventional regression analysis in several ways. A conventional regression model estimates a line of best fit—a line that passes through or comes closest to the largest number of estimated points for the relationship between variables. For estimating the efficiency of public services, it is more appropriate to estimate a curve than a line because a curve is more flexible and allows consideration of important features of the data, such as economies of scale. And because there are several types of providers—in this case higher education institutions, with different discipline emphases and missions—it is appropriate to estimate more than one curve. In addition, it is appropriate to estimate curves that provide the location of the efficient frontier of performance, which is a measure of what is possible, rather than the best fit, which offers a measure of average performance. A cost function is a frontier below which costs, at a given level of output, cannot fall. Costs above the frontier represent inefficiency.
For these reasons, the conventional technique of linear regression is refined in three ways for use in estimating the efficiency of public service provision.
First, a non-linear rather than linear functional form is used; in a non-linear functional form, the relationship between output and inputs is allowed to vary with scale.
Second, a “latent class” approach is applied so that separate regression curves are fitted for each of a number of categories of providers, with the data (not the analyst) determining, on a statistical likelihood basis, which providers belong in which group.
Third, a stochastic frontier method is used that separates the statistical residual (random deviations of the data from the line of best fit) into two components—representing cost inefficiencies and the traditional statistical measurement error—to displace the regression curve so that it represents the cost curve faced by efficient providers [6].
Figure 1 illustrates this method of estimating a cost function with a simple model that measures output using a single input variable, with costs dependent on the total level of output. Each of the circles and diamonds in the figure represents a single provider, and the position of each observation indicates how much output the provider produces at what cost. The scatter diagram shows that there is a positive correlation between output and costs—larger providers incur greater costs than smaller ones—but this correlation is quite weak.
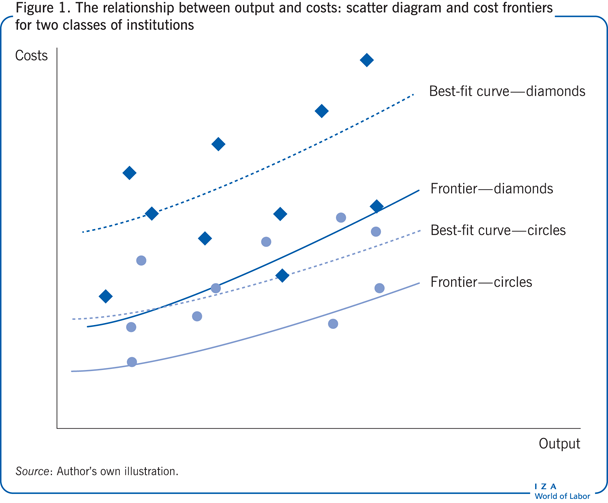
A stronger fit is provided if the correlation is estimated for two separate groups of providers, here represented by the circles and the diamonds. Each of the two groups comprises a number of separate providers, but there are (unobservable) characteristics that providers within each group have in common, but which differ across the groups. Costs are typically higher for the diamonds than for the circles and (for the most part, though not at very low levels of output) rise more steeply as output increases. The dotted curves represent the relationships between output and costs that provide the best fit to the data. The solid curves represent the cost frontiers for each class of provider; these are displaced from the best-fit relationships in order to show what the cost schedule looks like for an efficient provider within each class.
An illustration using higher education institutions in England
To illustrate how to use this methodology, consider the case of higher education institutions in England. These institutions produce graduates in various disciplines at various levels including both undergraduate and postgraduate study. They also produce research and engage in knowledge transfer and other activities with the broader community of business and other organizations. The extent to which different institutions engage in each of these activities varies considerably. Some institutions are heavily oriented toward sciences and engineering, others toward creative arts. Some have medical schools while others do not. Some institutions are highly research-intensive, while others have a much stronger teaching mission. Some focus primarily on undergraduate education, while others are more broad-based, with large numbers of postgraduate students.
These characteristics of institutions can all be captured using data on costs as the dependent variable and data on numbers of undergraduate and postgraduate students in each subject group, research income, and knowledge transfer activity (measured by income from intellectual property) as the explanatory variables. The non-linear model of costs estimated below includes linear and quadratic terms in each of these explanatory variables (capturing returns to scale) and also a set of interaction variables (capturing returns to scope). The interaction variables are two-way products of all the student number variables, two-way products between each of these and research, and the product of research and knowledge transfer variables. In addition, the model also includes control variables capturing the nature of each institution’s real estate (specifically the area covered by buildings that are on the Statutory List of Buildings of Special Architectural or Historical Interest) and the nature of the student intake (specifically the number of students originating from low-participation neighborhoods) as explanatory variables.
Data used in the illustrative example
Data on the numbers of full-time equivalent students in each of three broad discipline areas (medicine, other sciences, other subjects) and at undergraduate and postgraduate levels, as well as data on costs and research income (deflated to 2011 values) are obtained from the UK Higher Education Statistics Agency (HESA). While it is recognized that research income is likely to be an imperfect measure of research activity, evidence of high correlation between this measure and other metrics is provided [1], including publication and citation measures obtained from the Web of Science (). Data on income from intellectual property (deflated to 2011 values) are from the Higher Education Business and Community Interaction Survey. Data on the area of each university’s estate (square meters) accounted for by listed buildings and the number of young full-time undergraduate entrants coming from neighborhoods with a low participation rate in higher education are also obtained from HESA. The latter variable is intended to capture any extra costs that are due to gaps in the extent to which such students have been prepared for higher education by their experience of secondary education. Details of the impact of these last two variables on costs are not reported in this paper, but both influence costs in the expected direction. The non-linear model also controls for year and for the universities of Oxford and Cambridge.
The latent class stochastic frontier models used to obtain the results reported in this paper are estimated using Limdep software.
Interpreting results
Because the model includes non-linear and interaction terms, the results of the estimation exercise are not straightforward to interpret. The model does, however, allow estimating average incremental costs (at mean values for all variables) associated with each type of output produced. These measures show, for each output type (undergraduates in medicine, undergraduates in other sciences, and so on), how much the average production unit adds to total costs, given average levels of production of every other type of output [7].
Figure 2 reports the average incremental costs obtained by estimating two versions of the non-linear stochastic frontier model using data pooled across the years 2008/2009 through 2010/2011. The first column reports the average incremental costs obtained from a straightforward model in which the coefficients (or weights) on all of the explanatory variables are assumed to be constant across all providers. The other two columns show average incremental costs for the case in which there are two latent classes—that is, higher education providers are assumed to belong to one or the other of these classes, and the data are used to decide which providers belong in which class on the basis of what pattern of class membership best fits the data. In each case, the average incremental costs are reported for an institution producing mean (within the class) levels of each output.
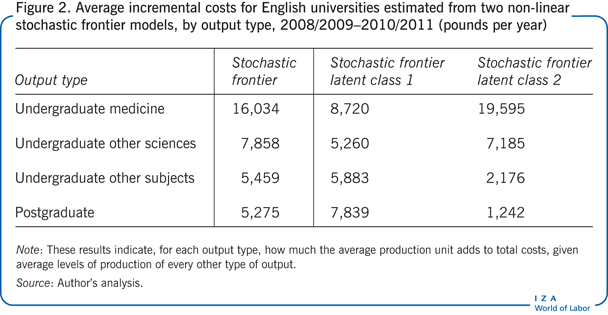
The pattern of average incremental costs reported in Figure 2 accords with intuition. Among undergraduate disciplines, medical education is the most costly to provide, followed by other sciences. The latent class model suggests that the costs of certain types of provision can vary quite dramatically across institutions; in the institutions in latent class 2, the costs of tuition outside the sciences are very low, but this is compensated for by much higher costs of provision in the sciences, particularly in medicine.
A degree of caution is warranted in interpreting these results, however, because they are based on a set of statistical coefficients, not all of which are estimated with precision. The main message is that costs vary across disciplines and across universities.
Calculating an efficiency score for each provider
The ratio of average incremental costs to marginal costs is conventionally used as a summary measure of returns to scale. If this measure is higher than one, economies of scale are observed; if the measure lies below one, economies of scale are exhausted. Figure 3 reports the product-specific returns to scale associated with each output type for each of the models considered in Figure 2, along with the Ray returns to scale (returns associated with a simultaneous increase in production of all outputs).
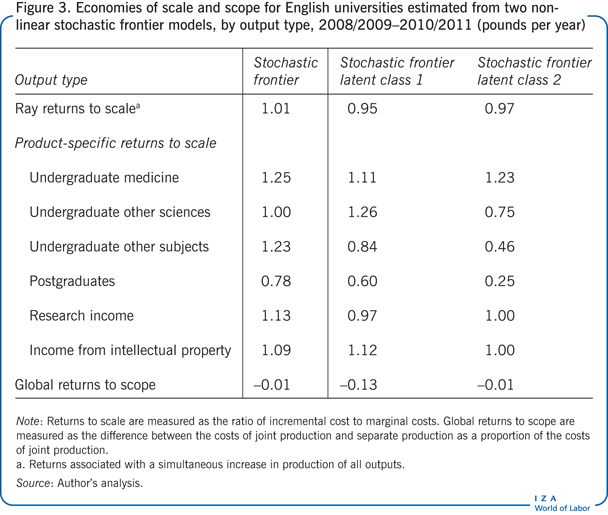
Figure 3 also reports a measure for global returns to scope, which is constructed as the difference between the costs of joint production of multiple products and their separate production as a proportion of the costs of joint production. If this measure exceeds zero, there are unrealized economies of scope; if it is negative, economies of scope are exhausted.
Once the cost frontier is estimated, it becomes a straightforward matter to evaluate an efficiency score for each provider by calculating the non-symmetric component of the statistical residual for each provider. This is tantamount to comparing the position of the frontier curves in Figure 1 with the observed values of costs and outputs for the service provider (controlling for the normal residual). If a provider is delivering a given amount of output at a cost that is substantially above the cost that the cost frontier demonstrates to be feasible, then presumably there is scope for that provider to improve its efficiency.
Fortunately, a method has been developed for disentangling the residual components and thus for allowing the computation of an efficiency score for each institution [8]. This efficiency score is constructed so that a perfectly efficient provider will have a score of one; less efficient providers will have lower scores.
The results reported in Figure 3 confirm those of other recent studies that find that scale economies associated with education outputs tend to be exhausted or close to being exhausted, while those associated with research are not [1]. It should be noted, however, that the returns to scale associated with students in medicine are somewhat higher than those associated with students in other subjects, suggesting that concentration of provision in this area is worthwhile. Moreover, there appear to be economies of scale associated with the generation and transfer of intellectual property. In common with other studies that use the frontier approach, there is no evidence here of global economies of scope.
The distribution of efficiency scores obtained from the stochastic frontier model without latent classes suggests that higher education institutions in England are, for the most part, reasonably efficient. Some 72% of institutions have efficiency scores of 0.85 or above. This rises to 76% in the model with two latent classes—not surprising, since the latent class model makes allowance for some of the unobserved heterogeneity between institutions.
While many institutions perform well on this metric, efficiency scores are much lower for a non-negligible minority of institutions. These are all relatively small and highly specialized institutions: examples include conservatories and art schools. Such institutions typically face unusually high costs because of the discipline-specific needs for bespoke provision; for example, music and art students need to be provided with dedicated studio space. This observation provides a good illustration of how a low efficiency score in a frontier analysis does not necessarily provide evidence of low efficiency—but it does point to areas where the quantitative analysis can profitably be supplemented with a more qualitative study. Moreover, differences in efficiency scores between apparently similar providers can be observed in the upper part of the distribution, and qualitative investigation of the factors that might underlie these differences is likely to prove fruitful as a means of benchmarking and disseminating good practice.
Limitations and gaps
In evaluating the efficiency of economic units, analysts are handicapped by the rather obvious fact that they can only observe producers that actually exist. The frontier is determined by what is known to be possible because it is observed, not by what might actually be possible. Some thinking outside of the box could conceivably offer solutions that are more efficient than any currently being implemented, but that is not captured in this analysis. Thus, this exercise is really evaluating the efficiency of each producer relative to some measure of current best practice—not relative to some ideal practice that is good for all time and space.
The statistical approach to estimating the model of costs may be described as parametric. It assumes a particular functional form for the costs model and assumes that the weights attached to each variable are constant across institutions—or at least across all institutions within each latent class. These assumptions may be inappropriate. For all sorts of reasons, different producers might face different cost structures. Research—by its nature involving the creation of new knowledge—is unique, and so the research done within each institution is distinct and has distinct implications for costs. Likewise, each institution has an intake of students with a unique set of needs, and those unique needs may affect costs in distinct ways.
However, there are methods that can be used to finesse the limitations of the parametric approach. Indeed, the latent class model goes some way toward doing this, while also recognizing that there is some measure of heterogeneity across institutions. The discussion presented here considers the existence of just two latent classes. In contrast, the work undertaken for the UK Department for Business Innovation and Skills provides results for a variety of models accommodating up to four latent classes [1]. A more comprehensive relaxation of the restrictions can be achieved by using a random parameter frontier model—which, by allowing each institution to have a distinct vector of weights attached to the variables in the model, is rather akin to a latent class model with as many classes as there are institutions. This approach has been adopted in other literature [9]. Alternatively, a wholly non-parametric method such as data envelopment analysis can be used; this approach eschews statistics in favor of linear programming as a means of identifying the frontier that can be aimed for by each institution [10].
The composition of the latent classes is of interest. Given the distinct missions of clearly identifiable groups of institutions of higher education in the UK, one might expect a clustering of research-intensive institutions in one latent class and a concentration of more teaching-intensive institutions in the other. In practice, however, the institutions do not sort themselves into the latent classes in a way that yields such an intuitive interpretation—each class includes a mix of research-intensive and teaching-intensive institutions. While the technical reasons underpinning the allocation of providers to classes are clear, an intuitive rationale is lacking.
More conceptually, it should be recognized that the definition of efficiency is inevitably moot. This is because, in choosing the structure of the cost model, the analyst is in effect declaring that certain variables are legitimate sources of differences in costs—and declaring that other variables, not included in the model, are not legitimate. Inter-institutional differences in costs that are due to differences in these excluded variables show up as variations in efficiency. But the choice of which variables to include in the model is inevitably a judgement call.
While a quantitative analysis of the kind reported here can provide a useful overview, it should be borne in mind that there are limitations in any statistical analysis. Providers of public services such as higher education differ from each other in a host of qualitative ways that are simply not captured by the data. Quantitative analysis can point to differences across providers that look interesting, but these need to be interrogated further using qualitative methods in order to gain a fuller picture and to ascertain whether the apparent differences in efficiency are indeed instructive and whether they can therefore serve to enhance practice.
Summary and policy advice
Statistical methods can be used to evaluate efficiency in public services, and differences that are uncovered can offer clues about good practice. The distribution of efficiency scores obtained from the stochastic frontier model suggests that institutions of higher education in England typically operate at high levels of efficiency. There are, however, some institutions that achieve relatively low efficiency scores. These are small and specialist institutions. Their costs may lie above the frontier, at least in part because they are small (and so cannot take advantage of economies of scale) and specialized (and so face idiosyncratic costs). Qualitative research is needed in these cases to establish more precisely the determinants underlying their high costs. To the extent that returns to scale are important, consideration should be given to merger as a means of realizing efficiencies.
Among larger institutions, differences in measured efficiency are relatively slight—but the differences that exist may be instructive. Further investigation, including qualitative analysis, may throw light on good practice, and, through benchmarking, may enable a system-wide improvement in how inputs are converted to outputs.
More generally, the set of tools used to evaluate the efficiency of public-sector service providers offers an important check on how well taxpayers’ money is being spent. Frontier methods should therefore be widely applied in government.
Acknowledgments
The author thanks an anonymous referee and the IZA World of Labor editors for many helpful suggestions on earlier drafts. This paper has drawn extensively on previous work by the author [1].
Competing interests
The IZA World of Labor project is committed to the IZA Guiding Principles of Research Integrity. The author declares to have observed these principles.
© Geraint Johnes