Elevator pitch
A strong association between incomes across generations—with children from poor families likely to be poor as adults—is frequently considered an indicator of insufficient equality of opportunity. Studies of such “intergenerational persistence,” or lack of intergenerational mobility, measure the strength of the relationship between parents’ socio-economic status and that of their children as adults. However, the association between equality of opportunity and common measures of intergenerational persistence is not as clear-cut as is often assumed. To aid interpretation researchers often compare measures across time and space but must recognize that reliable measurement requires overcoming important data and methodological difficulties.
Key findings
Pros
Intergenerational income elasticity, a measure of inequality transmitted between generations, is related to a well-developed conceptual framework.
Comparisons of intergenerational income persistence across countries, localities, and time reveal settings where intergenerational links are weaker; the impacts of poorly measured parental income on elasticity estimates are clear.
Correlations between positions in the income distribution may be a purer measure of persistence than elasticity; researchers are developing new measures to capture the size and direction of mobility.
Measures of intergenerational persistence across three generations are providing new insights.
Cons
Not all mechanisms driving intergenerational persistence are necessarily clearly related to fairness and equality of opportunity.
Data requirements for reliably comparing estimates of intergenerational mobility are stringent, resulting in considerable uncertainty, although the increasing availability of administrative data is leading to a step-change in knowledge.
The properties of new measures of intergenerational persistence are less well understood.
Author's main message
Measures of intergenerational mobility, such as intergenerational elasticity, help paint a broad picture of intergenerational inequalities. However, data limitations introduce biases, and any discussion of optimal intergenerational persistence entails value judgments, which must be clearly articulated. By using new measures and data, and comparing intergenerational persistence across countries, time, and localities, researchers have begun to develop a more nuanced picture of intergenerational persistence and the mechanisms driving it. That is critical for identifying the most effective policy levers to apply.
Motivation
Studies of intergenerational persistence are concerned with measuring the strength of the relationship between the socio-economic status of parents and the socio-economic outcomes of their children as adults. A strong association between incomes across generations (intergenerational income persistence) indicates that children from a poor family are likely to be relatively poor as adults and that the elite positions in society are closed to most people.
Strong intergenerational persistence is frequently considered an indicator of insufficient equality of opportunity. It is difficult, however, to distinguish the reasons behind differences in economic success. For example, if children from higher-income families put in more effort than children from other socio-economic groups, an association in outcomes across generations might not necessarily violate principles of equality of opportunity and may even be desirable in a meritocratic society that rewards effort. Thus policymakers must understand that any assertion about the optimal level of intergenerational persistence is not value-free.
Comparisons of levels of persistence across countries and over time are useful for putting estimates of intergenerational mobility in perspective. But for these comparisons to be based on reliable estimates, it is essential to use comparable data and methods. New estimates based on comparing intergenerational mobility at sub-national level use national administrative data to help overcome issues of comparability and offer important new insights into the drivers of mobility. Longer-term estimates based on surnames and data on multiple generations are also offering new insights on the role of the broader family and the validity of examining intergenerational mobility based only on parents’ and children’s data.
Discussion of pros and cons
The standard measure of intergenerational persistence
Intergenerational persistence can be measured in a variety of ways using various measures of socio-economic status. Among other measures, researchers have considered intergenerational links in family income, individual earnings, social class, occupational status, and education [1]. The most commonly used economic measure of intergenerational persistence links the earnings of fathers and their adult sons, although the combined incomes of parents and correlations with maternal income or daughters’ income are increasingly being taken into account.
The standard measure of intergenerational income persistence is obtained from a simple linear regression of children's logarithmic income on parents’ logarithmic income. The slope coefficient, referred to as beta, gives an estimate of the intergenerational elasticity of children's income with respect to their parents’ income. For example, say that one father had twice the income of another father. The wealthier father's child would then have 50% more income than the child of the poorer father if the estimated statistic is 0.5, 20% more if it is 0.2, and so on. If the elasticity is zero, that means that a child's adult income is not related at all to parental status, and so the best guess of a child's adult income would be to take the average for the child's cohort.
It is important to stress that intergenerational elasticity does not measure the causal relationship between incomes across generations; the intention is not to find out how the child's income as an adult would respond to a change in the parents’ income, everything else held constant. Rather, measures of intergenerational persistence provide a summary measure of intergenerational inequalities, assessing how children's outcomes vary with parental income and all the other factors that can vary alongside it, such as parents’ education, family culture, motivation, and child's ability.
One helpful comparison is with the Gini coefficient of cross-sectional income equality, where 0 describes the situation where national income is equally shared across the population and 1 describes the extreme case where all national income is held by one individual. The Gini coefficient provides a summary measure of the extent of cross-sectional inequality, but it does not provide any information about its source. The intergenerational elasticity measure performs a similar function for intergenerational inequality.
Data limitations in measuring intergenerational elasticity
An estimate of intergenerational elasticity is only as good as the underlying data on which it is based. Ideally, the intergenerational elasticity would be measured in terms of the parents’ and children's permanent income (expected long-term average income), since permanent income has the strongest impact on consumption and the closest link to well-being. Much has been written about the potential biases arising from the use of imperfect data. The sources of estimation biases are measurement error in the recording of parental income and the sensitivity of estimates to the lifecycle [1].
Measurement error can lead to underestimates of the intergenerational elasticity of children's income with respect to parents’ income. Early research on intergenerational persistence was based on survey datasets that often yielded error-ridden measures of income. Even when the survey income data were accurate, these measures were only weak predictors of long-term income, which is the variable of real interest. Simulations show that using a single year of earnings data can underestimate intergenerational persistence by 50% [2]. Two solutions have emerged.
One is to average fathers’ earnings over several periods to better approximate permanent income and to reduce the influence of measurement error.
A second solution is to use administrative data from tax records. Tax records have the dual advantage of being accurate records of income, assuming that tax evasion is not widespread, and being available over a longer period, so that lifetime income can be better approximated. So far these sources have been primarily exploited for the Nordic countries, Canada, and, very recently, the US. It is worth noting that all the recent contributions in the top journals on intergenerational mobility have been based on administrative data of this type, although its use is not always uncontentious as demonstrated by the criticisms of estimates based on US data in [3].
When lifetime measures of income are not available, it is important to measure the income of both generations at an age when their earnings are representative of earnings over their entire career; otherwise, lifecycle bias can affect the estimates. If the adult child's earnings are observed at too young an age, the degree of intergenerational income persistence will be underestimated. Young people with a high level of educational attainment (who are likely to be from wealthier backgrounds) will not yet be established in their careers, making it appear that their earnings are more weakly linked to their parents’ earnings than they would be if the adult child were older. Recent explorations of UK and Swedish data show steep increases in the intergenerational elasticity when measured in middle age compared to in the 20s and 30s [4],[5].
The standard measurement approach requires information on parental incomes and on children's incomes in adulthood, some 20–30 years later. These data are not always available. When income measures are available for adult children but missing for parents the two-sample instrumental variable approach has been used. This imputes the missing income using information on parental education and income. This approach has been used to derive an estimate of intergenerational mobility in countries where there are no other suitable data. However, it is hard to make legitimate comparisons across countries using this method. Comparing studies that use this approach with those that use a time-averaging approach on US data finds that estimates using the two-sample instrumental variable approach are about a third larger than estimates based on time-averaging of observed paternal earnings over a five-year period [6], [7], but it is hard to know how generally this applies.
A framework for analyzing the routes to intergenerational income persistence
The Becker–Tomes model provides a framework for analyzing the routes to intergenerational income persistence. The model starts with the idea that parents care about both their own consumption and that of their children as adults. Children's adult incomes are determined by endowments, which are present in the individual without any cost, and by investments made in their education and skills; these are costly. Endowments are to some extent inherited: on average, richer parents have better-endowed children. Because endowments are rewarded in the labor market, they account for some of the association between parents’ and children's incomes. Investments can also depend on family income if children (or their parents) cannot borrow to support further education. If there are such credit constraints, the children of poorer parents will receive too little education, and intergenerational persistence will be inefficiently high. Researchers have therefore searched for evidence of credit constraints. The evidence for their existence has been mixed, although recent contributions have highlighted that investment may be too low in early life for high-ability children from poor backgrounds [8], meaning they are unable to develop their potential.
The Becker–Tomes model therefore illustrates the difficulties of interpreting estimates of intergenerational persistence because inherited characteristics mean that intergenerational elasticities would be expected to take a non-zero value. In that case, how high is too high? Researchers have tried to answer this question by comparing intergenerational mobility between countries and regions and over time. The idea is that any intergenerational persistence that stems from endowments (for example, hereditary aspects) should be broadly constant across countries and localities. Thus, comparing international mobility in this way enables assessing which societies have relatively strong and which have relatively weak intergenerational persistence.
Comparisons of intergenerational elasticities across countries and localities
Figure 1 displays estimates of intergenerational elasticities for 16 countries, based on a literature survey conducted in 2013 [1] and updated in 2014. From that research, one estimate was chosen for each country. Selection was based on estimates obtained using the most comparable methods and cohorts. (One exception is the UK, whose estimate is an average from two studies.) Showing a range of estimates instead of selecting just one might have exaggerated the degree of uncertainty for countries for which there are more research studies. Additionally, it seems misleading to include estimates that are not comparable. In most cases, the selected estimates are based on parental income data that have been averaged over several years. Where such estimates are not available, the two-sample instrumental variable method was used, and estimates were reduced by 0.75 to adjust for the potential upward bias of estimates derived using this method.
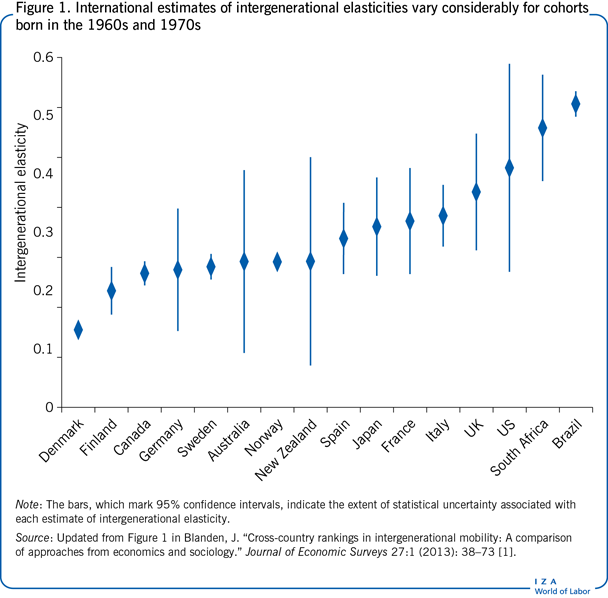
To give a sense of the reliability of the estimate chosen, the extent of statistical uncertainty associated with each estimate was also calculated. The degree of uncertainty is shown by the bars in Figure 1, which mark the 95% confidence interval (meaning that there is a 95% probability that the true value of the intergenerational elasticity is contained within the interval estimate). It is clear from Figure 1 that for some countries, particularly Australia, New Zealand, and the US, there is considerable uncertainty about whether the chosen estimate shows the true level of intergenerational elasticity. The reason for the greater uncertainty is that these estimates are drawn from very small samples. Despite the care taken in choosing the estimates, they may still generate controversy, as they depend in part on how the underlying research studies are interpreted and reported. For example, the estimate for the UK displayed here differs from that in [9], and there has been recent disagreement over some new estimates for the US. Figure 1 relies on an older estimate of intergenerational persistence [6], which puts the US estimate shown here in the middle of the range of methodologically acceptable estimates.
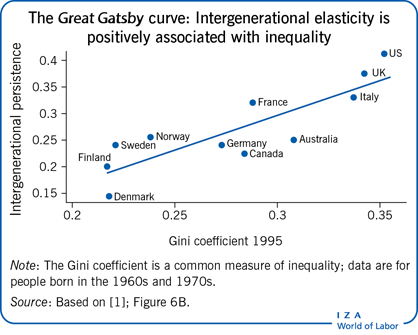
Comparisons of intergenerational persistence have been used to draw powerful policy conclusions. For example, two studies have taken estimates of intergenerational persistence from the literature and plotted them against Gini coefficient measures of cross-sectional inequality at a particular time, as in the Illustration [1], [9]. The resulting Great Gatsby curve indicates that in societies with high levels of income inequality, the extent of intergenerational persistence is higher. US government advisor and academic economist Alan Krueger called this relationship “the Great Gatsby curve,” after the novel by F. Scott Fitzgerald depicting social stratification in American society.
Of course, as is frequently noted, correlation does not imply causality. A positive association between cross-sectional inequality (Gini coefficient) and intergenerational inequality does not mean that narrowing the income distribution will promote intergenerational mobility. There could be many other variables associated with inequality that could be driving this result. In addition, as implied by the previous discussion of the uncertainty surrounding these estimates, there will always be concerns that the estimates are not fully comparable.
If there were a causal relationship, intergenerational persistence would be expected to rise for cohorts affected by rising income inequality. As Alan Krueger has asserted: “[P]ersistence in the advantages and disadvantages of income passed from parents to children…[will] rise by about a quarter for the next generation as a result of the rise in inequality that the US has seen in the last 25 years.” However, the rise in the US Gini coefficient began more than 30 years ago, so its impact would be expected to already be manifested in the trend in intergenerational income mobility. So far, however, evidence is unclear, with researchers finding rising, falling, and flat trends in intergenerational income persistence. In the UK, there is evidence of a rise in intergenerational persistence as inequality rose during the late 1970s and 1980s [10]. However, the evidence is based on children in just two week-long birth cohorts, making it hard to infer trends.
An alternative approach is to look at local areas within countries [11], [12]. This approach has advantages over both cross-country and over time comparisons by holding constant country effects (and therefore controlling for the fact that societies differ in many ways), using common data, and avoiding the complex macroeconomic and dynamic factors that might affect the evolution of mobility over time [12].
These new studies relate the extent of intergenerational persistence to inequality at the local level and other local characteristics, while a further study also attempts to distinguish cultural and political effects by considering the influence of the Canada–US border [12]. All studies find a correlation between cross-sectional and intergenerational inequality, as well as evidence that human capital investment by both the family and state has an important role in promoting mobility. This perspective that areas matter is strengthened by further evidence which finds important causal effects of the time children spend growing up in an area.
Alternative measures of intergenerational persistence
Most comparative work across countries and time periods has relied on the intergenerational income elasticity. One appeal of the elasticity measure is that it follows directly from the Becker–Tomes model for analyzing the routes to intergenerational income persistence, easing its interpretation. However, intergenerational elasticity does have limitations compared with other measures of intergenerational persistence. For example, intergenerational elasticity is mechanistically affected by changes in the income distribution. Thus, if inequality is growing, so that it is greater in the adult child's generation than in the father’s, this change in inequality will automatically show up as a higher intergenerational elasticity. This creates problems with making comparisons across countries and in interpreting the Great Gatsby curve.
An alternative measure of intergenerational persistence is the “Pearson correlation” of parents’ and children's incomes, which adjusts for differences in income inequality between the two generations, by multiplying intergenerational elasticity by the ratio of the standard deviation of parents’ incomes to the standard deviation of children's incomes. However, this is only one measure of the distribution of income. An alternative measure of intergenerational mobility is the “Spearman rank correlation.” This measure captures the correlation in income ranks completely independently of any changes in the distribution of income between the two generations. A Spearman rank of 1 indicates that sons exactly mimic their fathers’ rank in the income distribution.
The rank correlation is closely related to transition matrices. Transition matrices are derived by dividing the income distributions of parents and adult children into equal numbers of quantile groups, for example quintiles, and noting the proportion of adult children from each parental income quintile who finish in each quintile of the adult children's distribution. If all the children who begin in a particular parental income quintile remain in the same income quintile as adults, there is complete intergenerational immobility (all cells in the leading diagonal equal 1, and the others equal 0). If the starting income quintile has no effect on the destination quintile, there is complete intergenerational mobility (all cells in a given parental quintile equal 0.20). The rank correlation takes this measure to the limit by extending the number of categories to equal the number of observations in the sample.
Transition matrices are an improvement over the other measures mentioned so far because they clearly show the source of the intergenerational mobility. They can also indicate whether the effect varies at different levels of income and in different directions—whether the direction of mobility and the distance vary at different levels of income, showing whether children are moving up or down the income distribution and by how much.The intergenerational elasticity and correlations provide a single estimate to sum up mobility; an advantage over transition matrices which can provide many statistics. However, the study which considers the influence of the Canada–US border uses a novel machine-learning approach to combine a variety of measures of mobility derived from transition matrices and identify four “clusters” of mobility across the US and Canada, it seems likely that studies will increasingly make use of this approach and rely less on a single measure [12].
Until very recently understanding of the impact of measurement error and the lifecycle on measures of mobility based on correlations and transition matrices was limited. However, new results provide some reassurance, including the finding that rank-based measures are less susceptible than the elasticity measure to both sources of bias [13].
A very different approach to measuring mobility comes from the correlation in outcomes for those who share the same unusual surname [14]. This is found to indicate much stronger intergenerational persistence than indicated by data linking families, and is also found to be invariant across time and space. The implication in a 2014 study is that the general transmission of advantage is universal and long-lasting [14]. These results provide a challenge to the literature reviewed so far which uses variations in mobility levels as a way to understand mechanisms. One response has been to consider the influence of grandparents and other relations [15]. The data in this study allow the evaluation of the hypothesis that two-generation measures are substantial underestimates of dynastic transmissions as well as providing evidence on the direct effect of grandparents on grandchildren. So far results are exploratory but provide evidence against the idea that intergenerational persistence does not vary with context.
Limitations and gaps
Researchers are becoming increasingly aware of the empirical limitations of the intergenerational elasticity measure as well as of the difficulties in interpreting findings based on this measure. As a result, new measures and approaches are being used in empirical research. The emergence of better data in many countries and the capacity of machine learning are also encouraging researchers to broaden their approach and rely less on the elasticity. Alternative measures are also providing insights into the mechanisms that drive intergenerational mobility; this is particularly true for multigenerational measures of mobility.
Strong assertions have been made on the basis of the association between cross-sectional inequality and intergenerational income persistence. However, there are substantial gaps in knowledge. The validity of the Great Gatsby curve has been questioned, and even if its validity is accepted, its drivers are not fully understood. It seems likely that some of the positive association between persistence and inequality comes from a mechanistic association between the two measures. However new studies using alternative measures to look at local differences in mobility indicate that there is a relationship between inequality and mobility that is worthy of further study.
It is frequently claimed that high intergenerational persistence has implications for economic efficiency if the talents of children in poorer families are underdeveloped or underutilized. However, the optimum level of intergenerational mobility cannot be known a priori. Additional insight is gained by looking beyond headline measures of intergenerational mobility to understand the mechanisms that drive them.
Summary and policy advice
Knowledge of how to estimate intergenerational income persistence has grown considerably over the past 25 years. Researchers are increasingly moving away from the straightforward measure of intergenerational elasticity and are developing a more nuanced picture of intergenerational persistence. Because it is difficult to know what the optimum level of intergenerational persistence should be, researchers are increasingly comparing levels across countries, time, and localities. Insights are also obtained by looking beyond two generations. All of these extensions are helped by the increasing availability of administrative data and help identify the most effective policy levers to pull.
These are welcome developments because the extent to which advantage and disadvantage persist across society is a vital element of the shape of society, affecting its vibrancy and its success.
Acknowledgments
The author thanks two anonymous referees and the IZA World of Labor editors for many helpful suggestions on earlier drafts. This article has drawn in part on a draft chapter written for the Brookings Foundation/Human Capital and Equality of Opportunity Global Working Group Workshop on “Equality of Opportunity: The Facts and the Philosophy” in September 2014. Version 2 of the article emphasizes new work on comparable administrative data and explores the insights gained from looking across more than two generations. New “Key references” have been added [3], [5], [12], [13], [14], [15].
Competing interests
The IZA World of Labor project is committed to the IZA Code of Conduct. The author declares to have observed the principles outlined in the code.
© Jo Blanden