Elevator pitch
Standardized testing has become the accepted means of measuring a school’s quality. However, the associated rise in test-based accountability creates incentives for schools, teachers, and students to manipulate test scores. Illicit behavior may also occur in institutional settings where performance standards are weak. These issues are important because inaccurate measurement of student achievement leads to poor or ineffective policy conclusions. The consequences of mismeasured student achievement for policy conclusions have been documented in many institutional contexts in Europe and North America, and guidelines can be devised for the future.
Key findings
Pros
Each investigation of test score manipulation must be done in context and requires qualitative indicators to assess the extent of the problem.
Simple indicators can often characterize the nature of the test score manipulation.
Controlled retesting of students, grading from independent markers, or random assignment of external monitors on the test day should be part of any testing protocol.
Cons
Testing manipulation is a pervasive problem that may follow from accountability pressures, ineffective implementation of testing protocols, or student cheating.
Manipulation of test results distorts student performance indicators leading to misleading evaluations of the effectiveness of teachers and school programs.
The manipulation of test results is intentional; as such, performance indicators obtained by dropping corrupted data are not reliable.
Author's main message
Manipulation distorts the accuracy of student achievement indicators, calling into question their validity as a tool for evaluating teacher performance and to enforce school accountability policies. Evidence of compromised scores can be obtained using simple indicators, but these rarely reveal (with certainty) who manipulated test scores or the reasons for this behavior. The most compelling evidence on manipulation comes from controlled retesting of students and from random assignment of monitors to classrooms. These procedures should be part of any testing protocol in contexts where manipulation is a serious threat to the fidelity of results.
Motivation
Cross-national comparisons on student achievement are often used to gauge the performance of a country’s school system. Standardized tests collected in large-scale international surveys, such as the Trends in International Mathematics and Science Study, the Progress in International Reading Literacy Study, and the Programme for International Student Assessment, are often used as important inputs when designing educational policy. In addition, many countries have developed their own accountability systems to monitor performance on a continuous basis, and to set achievement standards. Performance-based accountability policies are often implemented to recognize school quality, allocate public funding, design pay incentives for teachers, and target the most problematic areas of a country’s education system. High-stakes testing can increase the likelihood of score manipulation; this distortion may seriously alter key indicators upon which policy conclusions are based.
Discussion of pros and cons
What is not revealed by the data?
Standardized test results have become increasingly used to form the basis for influential policy decisions. However, the validity of reported scores is far from certain, due in large part to the high potential for score manipulation. Due to the difficulty in determining, with certainty, the culprits and their motivations, the art of identifying manipulating behavior is now in the toolbox of so-called “forensic economists.”
As an example, international tests consistently show that Italian primary schools perform at a lower level than many other European countries. The same tests also show southern Italy is well behind northern Italy along many economic dimensions. However, Italy’s own accountability system points to a very different regional pattern, with primary school students in the south outperforming their northern counterparts [1]. This evidence follows from a national standardized test in mathematics and language, which is mandatory for all second- and fifth-grade students. In Italy, in contrast with the practice in many other countries, exams are proctored and marked by local teachers. Data show that lower per capita income in the province is associated with higher scores in mathematics [2] and that public spending is inversely related to achievement. This evidence stands in sharp contrast with empirical findings from a number of other studies. Taken at face value, these results contradict the need for conspicuous EU investments to support the modernization of education in southern Italy, as defined through the Italian National Operative Programme scheme.
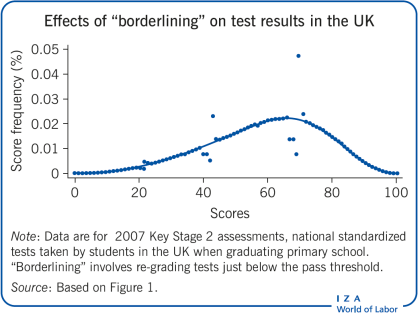
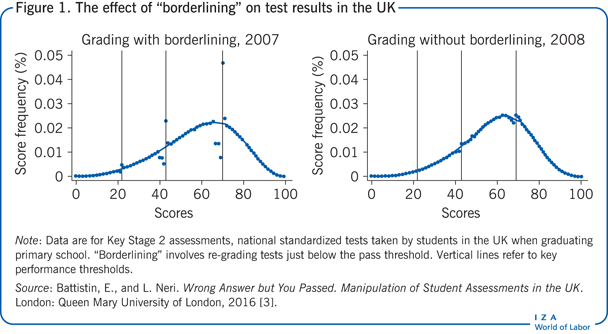
Another example comes from the UK’s Key Stage 2 tests, which are part of the national curriculum assessments, and are taken by all students graduating from primary school. Exams are locally proctored but, in contrast to Italy, marked by an external agency appointed by the Department for Education. Schools must meet minimum standards on the proportion of students that attain pre-defined levels of achievement, and results are used to form rankings in school league tables. Marking is conducted without knowing level thresholds, which are issued only at the end of the marking period. To avoid pupils being unfairly denied a level, until 2007 all exams falling three points or less below the pass mark were revisited; exams falling just above were not. This procedure, known as “borderlining,” was abolished in 2008 after it was deemed responsible for having boosted thousands of test scores and overstating school standards for more than two decades. Language score distributions for 2007 and 2008 are shown in Figure 1; they present a sharp inflation at thresholds used to award educational levels. The fraction of students scoring above the highest threshold in 2007 jumps by about three percentage points with respect to the value extrapolated through the continuous line. In 2008, this fraction drops to less than one percentage point. In other words, the reduction in the number of students who scored above the threshold for retesting decreased after the borderlining practice was eliminated, suggesting that borderlining may have caused this difference.
The surprising patterns observed in the relationship between achievement and school inputs for Italy, and discontinuities in score distributions for England, are suspected to result from intentional behavior, which can be loosely referred to as “score manipulation” or “testing manipulation.” These two examples have very different origins, but are far from unique. Many studies demonstrate that score manipulation is a pervasive problem, and that concerns about the reliability of assessment results increased with the proliferation of high-stakes testing regimes. Moreover, score manipulation makes accountability a thorny issue when it comes to the provision of incentives or the promise of sanctions. Early empirical contributions documented substantial cheating on standardized tests in Chicago public schools [4]. And intentional manipulation of student results has also been documented for the prestigious New York Regents Examinations [5].
Who manipulates scores, and why?
High-stakes testing refers to the use of standardized tests as objective measurements to award progress and register standards of quality. Tests may have direct consequences for students, for example, by setting a clear line between “pass” and “fail” when admission to the next grade is at stake. At the same time, accountability in education policies—which has become an increasingly frequent practice—holds schools liable for students’ progress. For example, in the US, the federal No Child Left Behind Act made standardized testing mandatory in all public schools in 2001, and imposed standards of progress, known as Adequate Yearly Progress, which included the threat of corrective actions. Scores from these tests are now used to measure students’ progress between different grade levels. These results are often used to assess teacher quality.
When incentives to improve test scores are high (as a result of consequential assessments), the temptation to manipulate results becomes a concrete, unintended distortion. Behavioral responses may be expected from all key players: students, teachers, and schools. Motivations for score manipulation vary, but in many institutional contexts, dishonesty is the most likely reason. Manipulation by dishonest means is cheating, a recurrent term in forensic economics. In many cases, teachers and school staff are the prime suspects.
For example, when students’ scores are used to make personnel decisions and create pay incentives, teachers may lower monitoring intensity and help students on the test day, or they may alter responses on student answer sheets to boost results. Pressure and incentives to manipulate may be high for schools falling short if the risk of punitive consequences is real. A jury in Atlanta recently convicted a number of teachers and administrators of racketeering in a state-wide cheating scandal, arguably the worst since the No Child Left Behind Act came into force. Of course, students may cheat as well, and survey data indicates that cheating in the classroom is widespread [6].
To make things worse, otherwise honest students or teachers are incentivized to manipulate test scores due to their peers’ fraudulent behavior, known as the “social multiplier effect.” This implies that manipulation may stem from the direct effect of isolated events (e.g. some students cheating) combined with the indirect effect of the behavioral response of others. Significant social multiplier effects in student cheating were found at primary and lower secondary schools in Italy [7], and universities in the US [8]. The takeaway message from these studies is that more than twice as many students cheated than would otherwise have done.
Finally, it should be understood that dishonesty is not the only reason for test manipulation. For instance, incentives to manipulate scores may also arise in public school systems where worker performance standards are weak [1]. Poor effort, or shirking, by school staff in adhering to test protocols may occur because of a lack of accountability, rather than an overabundance of it. This likely reflects weak student engagement in low stake exams (i.e. students don’t really care about the outcomes), yielding overall biased score distributions. Score manipulation by teachers may also result from a genuine willingness to help. Students falling just below an important grade boundary may benefit from having their score manipulated upwards [3], or discretion in grading may favor students from the most disadvantaged backgrounds [5]. This type of manipulation may not reflect any accountability-driven cheating behavior. However, regardless of the motivation, the resulting mismeasurement of real student achievement may affect subsequent policy initiatives.
Anatomy and consequences of manipulation
The anatomy of the manipulation problem is most simply understood by contrasting “raw scores” (scores observed in the data) to “true scores” (scores that would have been observed had manipulation not taken place). Policy-relevant quantities, such as average score or percentage of students scoring at a pre-defined level, are defined using student’s true scores. When scores are not manipulated, raw scores correspond to true scores for all students, and data reveal the true quantity of interest. When manipulation occurs, however, a fraction of scores is corrupted. In this case, raw scores do not equal true scores for some students and raw data do not yield the correct class aggregate (e.g. average test scores in a class). For example, if the fraction of manipulated scores is 10%, then only 90% of exams used to compute the average class score are honest. If contamination is substantial, the average score observed may be far off the real average.
This characterization can be used to discuss the taxonomy of potential problems challenging policy conclusions in the presence of manipulation.
Detection of manipulated scores. It is rarely known for sure which scores are manipulated. This implies that the fraction of students with corrupted scores is not known in general. The incidence of manipulation is usually presumed using statistical models to detect outliers; for example, by flagging classes with an abnormally high performance or high concentration in response patterns relative to the population average. However, indicators of presumed testing manipulation are not exempted from classification errors (e.g. honest exams may be incorrectly identified as corrupted), which adds an additional layer of complication to the problem. Unfortunately, imprecise measures of the fraction of corrupted scores are usually the rule rather than the exception.
Characterization of manipulated scores. Test score manipulation is almost certainly not random. Consider manipulation done by teachers altering student answer sheets in an attempt to improve scores. It seems that teachers would be more likely to manipulate exams of low-performing students. Assuming this is the case, it presents a selection problem: even if corrupted scores were precisely identified and discarded, the average of honest scores would not coincide with the score average for all students. In other words, policy-relevant quantities cannot be estimated by excluding manipulated data. Or, if they were, then conclusions would be valid only if score manipulation is the result of some random process, which is essentially unthinkable in this context.
Computation of counterfactual scores. Of course, to perform adjustments one would like to assess the true performance for students with manipulated scores. However, as this quantity represents a counterfactual (an event that cannot be observed in reality), it cannot be retrieved from data. It follows that assumptions will always be required about what the scores would look like without manipulation. When the fraction of corrupted scores is important, policy conclusions may be sensitive to these assumptions.
The three problems discussed can be conceptualized by stating that raw data yield a contaminated version of true scores. Contamination in this setting arises because a fraction of the data is manipulated, and this fraction is usually unknown. In the likely scenario of non-random manipulation, the distribution of true scores cannot be retrieved [9].
The main consequences for drawing policy conclusions can be summarized as follows:
Manipulation precludes knowledge of score distributions. While the above examples focus on score averages, the same arguments apply when evaluating the number of scores above a pre-defined level, dispersion of scores across students, or changes over time in a student’s score, all of which are needed to compute value-added (a measure of the progress students make between different stages of education). The takeaway message is that, if ignored, manipulation may lead to incorrect policy conclusions for funding and accountability.
Manipulation biases correlations between scores and school inputs. It is often assumed that “errors” in scores do not change the sign of the correlation between achievement and other school or student characteristics; such errors are typically thought to diminish this correlation. Unfortunately, this is only true in special cases, which are most likely contaminated by the sort of measurement errors introduced when manipulation occurs. Pervasive score manipulation may even flip the direction of the correlation between student outcomes and their characteristics. Going back to the Italian primary schools example discussed above, the negative correlation between per-capita income and scores masks higher manipulation rates in southern regions of the country [2]. The takeaway message is that manipulation may cause unobserved distortions when interpreting the correlation between school achievement and economic development.
Can manipulation be detected?
In practice, it is very difficult to know for sure which scores are manipulated. Instead, manipulation is presumed from algorithms aimed at detecting outliers, in this case referring to students or classes that exhibit suspicious patterns of answers or unusually large scores. Any indicator of manipulation must therefore be taken with a grain of salt, as it does not constitute proof of corrupted scores. The possibility of misclassification is real, and a formal solution to this problem calls for a number of additional assumptions that are too technical to list here [2]. Moreover, anomalies in the data are not necessarily the result of manipulation.
Simple statistics can be used as “red flags” to identify likely instances of manipulation. The following examples are frequently used for this purpose, and can be easily computed using standard statistical and econometric software.
Fluctuations in test scores [4]. This is a simple yet persuasive indicator that can be computed when the same statistical unit (e.g. student, class, or school) is followed over time. Assume that students can be identified across grades using administrative data on standardized tests. The idea is to detect “large” scores in the current year relative to how the same student performed in the past. As gains that are solely the result of manipulation don’t generate permanent changes in achievement, future scores will return to the mean. Manipulation should induce fluctuations over time in a student’s scores, unless, of course, illicit behavior is done persistently across grades. Because variation in the performance of one student may reflect individual specific shocks (like illness), this indicator is more reliable when constructed for the class.
Suspicious patterns of answers [4], [10]. This indicator requires item-level (i.e. individual test question) scores. In its simplest form, this is a Gini index of response patterns (i.e. an analysis of the statistical dispersion of answers). As an example, suppose that manipulation follows from altering a string of consecutive questions in a number of answer sheets before an electronic scanner reads them. An extreme version of this is wholesale “curbstoning”: copying an entire answer sheet. Accountability considerations often motivate manipulation that targets particularly difficult items. As a result, one might find cases in which students answer difficult questions correctly, but get easier questions wrong. More generally, manipulation may produce disproportionately similar blocks of answers for many students, increasing data concentration. Higher concentration in response patterns may also follow from students cheating on multiple-choice tests, which is the object of a rich literature on detection methods in educational statistics [11]. Indexes aimed at detecting abnormal concordance of (correct or incorrect) answers between any pair of students, also considering seating arrangements in the classroom during the test, are other examples.
Cluster analysis [12]. The two indicators listed above are strongly correlated when scores are manipulated. Nearly perfect curbstoning boosts the overall performance of a class and affects the standard deviation of scores within the class. Thus, class averages and standard deviations are also summary statistics worth considering when manipulation is suspected. Instead of using these indicators individually, one may consider combining them into a single index, which hopefully presents better properties for outlier detection. This is the approach followed by the Italian Istituto Nazionale per la Valutazione del Sistema dell’Istruzione (INVALSI). INVALSI employs cluster analysis, using the following inputs: within-class information on the average and standard deviation of scores, proportion of missing items, and variability in responses. Cluster analysis seeks regularities in data and groups classes with those that are similar to each other. INVALSI identifies classes with manipulated scores as those in an “extreme” cluster. In practice, these are classes with abnormally high performance, small dispersion of scores, low proportion of missing items, and high concentration in response patterns.
The above indicators only serve as telltales, and will hardly identify (with any certainty) who has conducted the manipulation. The most compelling evidence on manipulation comes from controlled retesting of students [4] and external monitoring in the class on the test day [10], [13]. In a well-known experiment, a sample of Chicago public school students was retested under controlled circumstances that eliminated opportunities to cheat [4]. The sampling design considered classes with teachers suspected of cheating (i.e. classes with scores nearly twice as large as the typical score) and randomly selected classes. Scores on the retest for suspicious classes were found to be much lower, suggesting large declines associated with monitoring and confirming the suspicions about teachers’ complicities.
Additional tools to deter teacher and student cheating are marking by independent sources, random allocation of seats to students [10], and multiple versions of the same exam with questions presented in random sequence. For example, one study found that students sitting next to one another during testing had a statistically larger number of incorrect answers in common than students sitting far apart, suggesting anomalous similarities in response patterns [10]. When students were assigned random seating instead of getting to pick their own seats, these correlations disappeared.
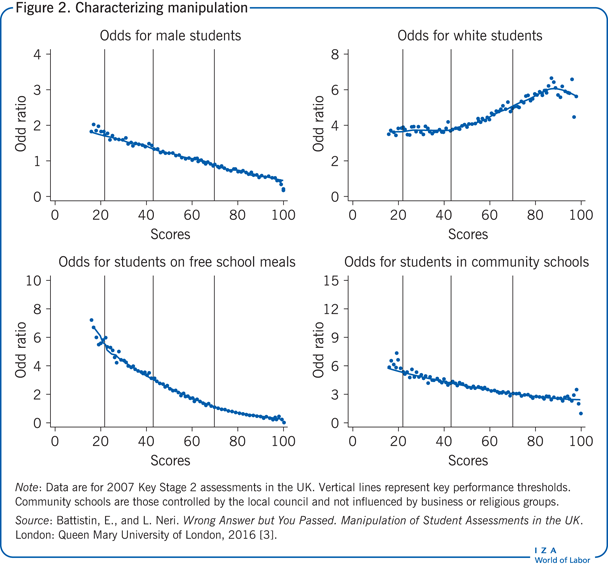
Finally, the institutional setting itself might suggest scores for which manipulation is most likely, as well as the origin of this problem. This is the case for the tests considered in Figure 1; the UK’s Department of Education identified the prevailing issue (score inflation around key grading thresholds) and subsequently delivered a policy response (elimination of the borderlining procedure). Figure 2, computed from the same data, suggests that manipulation does not vary systematically across students according to demographics or school characteristics. The profiles for gender, ethnicity, social status, and school type remain continuous across the relevant grading thresholds, which is consistent with the idea that score inflation is not typically aimed at helping particular groups of students or schools. The origin of manipulation here seems to be a genuine willingness to round up students’ scores that are marginally below the pass mark [3]. By contrast, a similar characterization of score manipulation in the New York Regents Examinations—statewide examinations in core high school subjects that are graded locally—suggests that teachers seek to move poor and minority students past performance cutoffs [5].
Limitations and gaps
Even when the origin of manipulation is revealed by the institutional context, the problem remains that affected students are likely selected along dimensions that are unobservable to the analyst. This poses a selection problem. For instance, teacher cheating motivated by accountability concerns will likely inflate exams for the worst students. Arguing that cheating is therefore more likely at the lower end of the achievement distribution is, however, not enough to know what the true score distribution would have looked like had cheating not taken place. This is the main challenge for the computation of reliable indicators of student achievement if one has reasons to believe that manipulation is a serious threat. In these contexts, standardized testing conducted without rigorous monitoring can lead to results that offer little help for designing effective policy interventions.
Retesting, as shown in [4], is one way to retrieve counterfactuals, but this, of course, requires considerable time and additional data. Without retesting, there is not a golden rule to construct counterfactuals for manipulated scores. Assumptions must be motivated from knowledge of the institutional context, or from data availability. For example, counterfactual distributions in Figure 1 can be obtained by considering continuous lines in the two panels. As one would expect score distributions to be relatively “smooth” around performance thresholds, a simple yet convincing strategy is to extrapolate threshold patterns from data observed away from the points in question. The difference between counterfactual distributions (represented by the continuous lines) and observed distributions (represented by the dots) conveys the message that score inflation is more likely for exams falling close to critical thresholds.
Alternative strategies are possible, of course, but almost inevitably call for more technical assumptions that require discussions on a case-by-case basis and are beyond the scope of this article (see [1], [9], [11] for examples, as well as the growing literature on forensic economics).
Summary and policy advice
The proliferation of high-stakes testing as part of accountability policies (as with the No Child Left Behind Act) parallels the increased number of cheating allegations in various countries, most notably the US. However, it is not only increased accountability that creates incentives to manipulate; such incentives may also arise in school systems with weak employee performance standards. The tendency for school staff to adhere to test administration protocols and grading standards may be limited because of moral hazard in effort, rather than by accountability concerns. Overall, it is fair to conclude that score manipulation is an unintended consequence of standardized testing, and further, that it may go unrecognized or unaddressed in all institutional contexts.
Identifying classes or students with manipulated scores is a difficult task. Indicators can be constructed to detect outliers in the data along a multiplicity of dimensions. Still, misclassification (i.e. honest scores that are incorrectly identified as corrupted) is a real threat. Any indicator should be taken with a grain of salt, and subjective judgment is always needed to understand whether the incidence of manipulation is important for the context under investigation.
Pervasive manipulation distorts indicators of school and student performance, as well as their relationship with corresponding characteristics. In particular, the computation of the progress students make between different stages of education may be strongly affected. The promise of rewards or sanctions based on (contaminated) indicators of achievement may exacerbate inequalities in student achievement.
The most compelling evidence on score manipulation comes from controlled retesting of a random sample of students, and from random assignment of external monitors to schools and classes on the test day. This evidence demonstrates that cheating can be virtually eliminated through the implementation of proper safeguards. These solutions (controlled retesting and external monitors) should be included in testing protocols whenever manipulation is considered a serious threat to the validity of test results.
Acknowledgments
The author thanks an anonymous referee and the IZA World of Labor editors for many helpful suggestions on earlier drafts. Ongoing work of the author with Josh Angrist [1], Michele De Nadai [2], Lorenzo Neri [3], and Daniela Vuri [1], [2] contains a larger number of background references for the material presented here, and has been used intensively in all major parts of this article. The views expressed here are those of the author alone.
Competing interests
The IZA World of Labor project is committed to the IZA Guiding Principles of Research Integrity. The author declares to have observed these principles.
© Erich Battistin